HUMAN DEVELOPMENT REPORT 2014 Sustaining Human Progress Reducing Vulnerabilities and Building Resilience
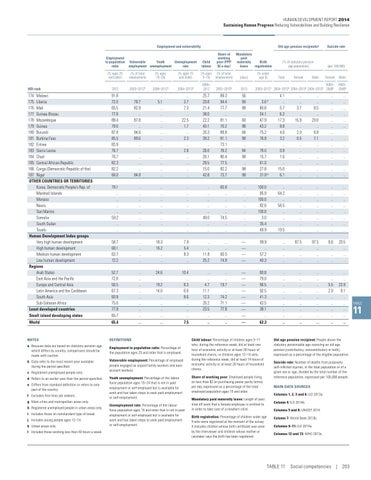
Employment and vulnerability Employment to population ratio (% ages 25 and older)
Vulnerable Youth Unemployment employment unemployment rate
Child labour
Share of working poor (PPP $2 a day)
(% of total employment)
(% ages 15 and older)
(% ages 5–14)
(% of total employment) 2003–2010b
2013
(% ages 15–24)
Mandatory paid maternity Birth leave registration (days)
HDI rank
2012
2003–2012b
2008–2012b
2004–2013b
2005– 2012
174 Malawi 175 Liberia 176 Mali 177 Guinea-Bissau 178 Mozambique 179 Guinea 180 Burundi 181 Burkina Faso 182 Eritrea 183 Sierra Leone 184 Chad 185 Central African Republic 186 Congo (Democratic Republic of the) 187 Niger OTHER COUNTRIES OR TERRITORIES Korea, Democratic People’s Rep. of Marshall Islands Monaco Nauru San Marino Somalia South Sudan Tuvalu Human Development Index groups Very high human development High human development Medium human development Low human development Regions Arab States East Asia and the Pacific Europe and Central Asia Latin America and the Caribbean South Asia Sub-Saharan Africa Least developed countries
91.8 72.0 65.5 77.8 89.4 79.0 87.8 85.5 83.9 76.7 76.7 82.3 82.2 66.0
.. 78.7 82.9 .. 87.8 .. 94.6 89.6 .. .. .. .. .. 84.8
.. 5.1 .. .. .. .. .. .. .. .. .. .. .. ..
.. 3.7 7.3 .. 22.5 1.7 .. 2.3 .. 2.8 .. .. .. ..
25.7 20.8 21.4 38.0 22.2 40.1 26.3 39.2 .. 26.0 26.1 28.5 15.0 42.8
89.3 94.4 77.7 .. 81.1 70.2 89.8 81.1 73.1 78.2 80.4 77.5 82.2 73.7
56 90 98 .. 60 98 84 98 .. 84 98 .. 98 98
79.1 .. .. .. .. 59.2 .. ..
.. .. .. .. .. .. .. ..
.. .. .. .. .. .. .. ..
.. .. .. .. .. .. .. ..
.. .. .. .. .. 49.0 .. ..
60.8 .. .. .. .. 74.5 .. ..
.. .. .. .. .. .. .. ..
58.7 68.1 63.7 72.2
.. .. .. ..
18.3 16.2 .. ..
7.9 5.4 8.3 ..
.. .. 11.8 25.2
.. .. 60.5 74.9
52.7 72.8 56.5 67.3 60.9 75.0 77.8
.. .. .. .. .. .. ..
24.6 .. 19.2 14.0 .. .. ..
10.4 .. 8.3 6.6 8.6 .. ..
.. .. 4.7 11.1 12.3 26.2 23.5
Small island developing states
65.7
..
..
..
World
65.4
..
..
7.5
NOTES
DEFINITIONS
a Because data are based on statutory pension age, which differs by country, comparisons should be made with caution.
Employment to population ratio: Percentage of the population ages 25 and older that is employed.
b Data refer to the most recent year available during the period specified.
Vulnerable employment: Percentage of employed people engaged as unpaid family workers and ownaccount workers.
c Registered unemployed people only. d Refers to an earlier year than the period specified. e Differs from standard definition or refers to only part of the country. f Excludes first-time job seekers. g Main cities and metropolitan areas only. h Registered unemployed people in urban areas only. i Includes those on nonstandard type of break. j Includes young people ages 12–14. k Urban areas only. l Includes those working less than 40 hours a week.
Youth unemployment: Percentage of the labour force population ages 15–24 that is not in paid employment or self-employed but is available for work and has taken steps to seek paid employment or self-employment. Unemployment rate: Percentage of the labour force population ages 15 and older that is not in paid employment or self-employed but is available for work and has taken steps to seek paid employment or self-employment.
(% under age 5)
Old age pension recipientsa
Suicide rate
(% of statutory pensionage population)
(per 100,000)
Total
Female
Male
2005–2012b 2004–2013b 2004–2013b 2004–2013b
.. 3.6 d 80.8 24.1 47.9 43.2 75.2 76.9 .. 78.0 15.7 61.0 27.8 31.8 d
Female
Male
2003– 2009b
2003– 2009b
4.1 .. 5.7 6.2 17.3 8.8 4.0 3.2 .. 0.9 1.6 .. 15.0 6.1
.. .. 3.7 .. 15.9 .. 2.0 0.5 .. .. .. .. .. ..
.. .. 8.5 .. 20.0 .. 6.8 7.1 .. .. .. .. .. ..
.. .. .. .. .. .. .. .. .. .. .. .. .. ..
.. .. .. .. .. .. .. .. .. .. .. .. .. ..
100.0 95.9 100.0 82.6 100.0 3.0 35.4 49.9
.. 64.2 .. 56.5 .. .. .. 19.5
.. .. .. .. .. .. .. ..
.. .. .. .. .. .. .. ..
.. .. .. .. .. .. .. ..
.. .. .. .. .. .. .. ..
— — — —
99.9 .. 57.2 40.3
.. .. .. ..
87.5 .. .. ..
97.5 .. .. ..
6.6 .. .. ..
20.5 .. .. ..
.. .. 19.7 .. 74.2 71.1 77.8
— — — — — — —
80.8 79.0 96.5 92.5 41.3 43.5 38.1
.. .. .. .. .. .. ..
.. .. .. .. .. .. ..
.. .. .. .. .. .. ..
.. .. 5.5 2.0 .. .. ..
.. .. 23.9 8.1 .. .. ..
..
..
—
..
..
..
..
..
..
..
..
—
62.3
..
..
..
..
..
Child labour: Percentage of children ages 5–11 who, during the reference week, did at least one hour of economic activity or at least 28 hours of household chores, or children ages 12–14 who, during the reference week, did at least 14 hours of economic activity or at least 28 hours of household chores. Share of working poor: Employed people living on less than $2 (in purchasing power parity terms) per day, expressed as a percentage of the total employed population ages 15 and older. Mandatory paid maternity leave: Length of paid time off work that a female employee is entitled to in order to take care of a newborn child. Birth registration: Percentage of children under age 5 who were registered at the moment of the survey. It includes children whose birth certificate was seen by the interviewer and children whose mother or caretaker says the birth has been registered.
Old age pension recipient: People above the statutory pensionable age receiving an old age pension (contributory, noncontributory or both), expressed as a percentage of the eligible population. Suicide rate: Number of deaths from purposely self-inflicted injuries, in the total population or of a given sex or age, divided by the total number of the reference population, expressed per 100,000 people. MAIN DATA SOURCES Columns 1, 2, 3 and 6: ILO 2013a. Column 4: ILO 2014b. Columns 5 and 8: UNICEF 2014. Column 7: World Bank 2013b. Columns 9–11: ILO 2014a. Columns 12 and 13: WHO 2013c.
TABLE 11 Social competencies | 203
TABLE
11