TABLE
11
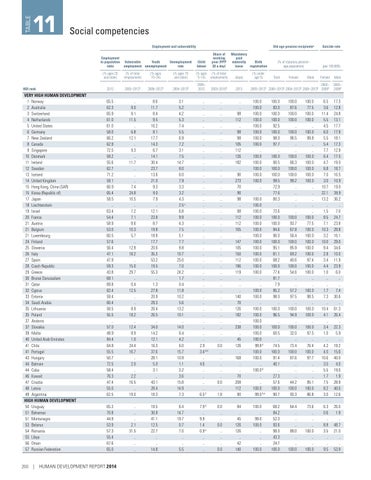
Social competencies Employment and vulnerability Employment to population ratio (% ages 25 and older)
HDI rank
VERY HIGH HUMAN DEVELOPMENT 1 Norway 2 Australia 3 Switzerland 4 Netherlands 5 United States 6 Germany 7 New Zealand 8 Canada 9 Singapore 10 Denmark 11 Ireland 12 Sweden 13 Iceland 14 United Kingdom 15 Hong Kong, China (SAR) 15 Korea (Republic of) 17 Japan 18 Liechtenstein 19 Israel 20 France 21 Austria 21 Belgium 21 Luxembourg 24 Finland 25 Slovenia 26 Italy 27 Spain 28 Czech Republic 29 Greece 30 Brunei Darussalam 31 Qatar 32 Cyprus 33 Estonia 34 Saudi Arabia 35 Lithuania 35 Poland 37 Andorra 37 Slovakia 39 Malta 40 United Arab Emirates 41 Chile 41 Portugal 43 Hungary 44 Bahrain 44 Cuba 46 Kuwait 47 Croatia 48 Latvia 49 Argentina HIGH HUMAN DEVELOPMENT 50 Uruguay 51 Bahamas 51 Montenegro 53 Belarus 54 Romania 55 Libya 56 Oman 57 Russian Federation
200
Vulnerable Youth Unemployment employment unemployment rate
Child labour
Share of working poor (PPP $2 a day)
(% of total employment)
(% ages 15 and older)
(% ages 5–14)
(% of total employment)
2004–2013b
2005– 2012
(% ages 15–24)
2012
2003–2012b
65.5 62.3 65.9 61.0 61.0 58.0 66.2 62.9 72.5 59.2 55.6 62.7 71.2 59.1 60.9 65.4 58.5 .. 63.4 54.4 58.9 53.0 60.5 57.6 56.4 47.1 47.9 59.3 43.8 68.1 89.8 62.4 59.4 60.4 58.5 55.5 .. 57.0 49.9 84.4 64.8 55.5 50.7 72.5 58.4 76.3 47.4 55.0 62.5
.. 9.0 9.1 11.5 .. 6.8 12.1 .. 9.3 .. 11.7 .. .. .. 7.4 24.8 10.5 .. 7.2 7.1 8.6 10.3 5.7 .. 12.8 18.2 .. 15.0 29.7 .. 0.4 12.5 .. .. 8.9 18.2 .. 12.4 8.9 1.0 24.4 16.7 .. 2.0 .. 2.2 16.5 .. 19.0
8.6 11.7 8.4 9.5 16.2 8.1 17.7 14.3 6.7 14.1 30.4 23.7 13.6 21.0 9.3 9.0 7.9 .. 12.1 23.8 8.7 19.8 18.8 17.7 20.6 35.3 53.2 19.5 55.3 .. 1.3 27.8 20.9 28.3 26.4 26.5 .. 34.0 14.2 12.1 16.3 37.6 28.1 5.0 3.1 .. 43.1 28.4 18.3
3.1 5.2 4.2 5.3 7.4 5.5 6.9 7.2 3.1 7.5 14.7 8.0 6.0 7.9 3.3 3.2 4.3 2.5 c 6.8 9.9 4.3 7.5 5.1 7.7 8.8 10.7 25.0 7.0 24.2 1.7 0.4 11.8 10.2 5.6 13.2 10.1 .. 14.0 6.4 4.2 6.0 15.7 10.9 1.1 3.2 3.6 15.8 14.9 7.3
65.3 70.8 44.9 53.9 57.3 55.4 67.6 65.0
.. .. .. 2.1 31.5 .. .. ..
18.5 30.8 41.1 12.5 22.7 .. .. 14.8
6.4 14.7 19.7 0.7 7.0 .. .. 5.5
| HUMAN DEVELOPMENT REPORT 2014
2008–2012b
Mandatory paid maternity Birth leave registration (days)
(% under age 5)
Old age pension recipientsa
Suicide rate
(% of statutory pensionage population)
(per 100,000)
Total
Female
Male
2005–2012b 2004–2013b 2004–2013b 2004–2013b
Female
Male
2003– 2009b
2003– 2009b
2003–2010b
2013
.. .. .. .. .. .. .. .. .. .. .. .. .. .. .. .. .. .. .. .. .. .. .. .. .. .. .. .. .. .. .. .. .. .. .. .. .. .. .. .. 2.9 3.4 d,e .. 4.6 .. .. .. .. 6.5 d
.. .. .. .. .. .. .. .. .. .. .. .. .. .. .. .. .. .. .. .. .. .. .. .. .. .. .. .. .. .. .. .. .. .. .. .. .. .. .. .. 0.0 .. .. .. .. .. 0.0 .. 1.8
.. .. 98 112 .. 98 98 105 112 126 182 .. 90 273 70 90 98 .. 98 112 112 105 .. 147 105 150 112 196 119 .. .. .. 140 70 126 182 .. 238 .. 45 126 .. 168 .. .. 70 208 112 90
100.0 100.0 100.0 100.0 100.0 100.0 100.0 100.0 .. 100.0 100.0 100.0 100.0 100.0 .. .. 100.0 100.0 100.0 100.0 100.0 100.0 100.0 100.0 100.0 100.0 100.0 100.0 100.0 .. .. 100.0 100.0 .. 100.0 100.0 100.0 100.0 100.0 100.0 99.8 d 100.0 100.0 .. 100.0 d .. .. 100.0 99.0 d,e
100.0 83.0 100.0 100.0 92.5 100.0 98.0 97.7 .. 100.0 90.5 100.0 100.0 99.5 72.9 77.6 80.3 .. 73.6 100.0 100.0 84.6 90.0 100.0 95.1 81.1 68.2 100.0 77.4 81.7 7.9 85.2 98.0 .. 100.0 96.5 .. 100.0 60.5 .. 74.5 100.0 91.4 40.1 .. 27.3 57.6 100.0 90.7
100.0 87.6 100.0 100.0 .. 100.0 96.5 .. .. 100.0 66.3 100.0 100.0 99.2 .. .. .. .. .. 100.0 93.7 67.8 56.4 100.0 85.9 69.2 46.6 100.0 54.6 .. .. 57.2 97.5 .. 100.0 94.9 .. 100.0 32.0 .. 73.4 100.0 87.6 .. .. .. 44.2 100.0 93.3
100.0 77.5 100.0 100.0 .. 100.0 99.8 .. .. 100.0 100.0 100.0 100.0 100.0 .. .. .. .. .. 100.0 77.5 100.0 100.0 100.0 100.0 100.0 97.4 100.0 100.0 .. .. 100.0 98.5 .. 100.0 100.0 .. 100.0 97.5 .. 76.4 100.0 97.7 .. .. .. 85.1 100.0 86.8
6.5 3.6 11.4 5.5 4.5 6.0 5.5 5.4 7.7 6.4 4.7 6.8 7.0 3.0 10.7 22.1 13.2 .. 1.5 8.5 7.1 10.3 3.2 10.0 9.4 2.8 3.4 4.4 1.0 .. .. 1.7 7.3 .. 10.4 4.1 .. 3.4 1.0 .. 4.2 4.0 10.6 3.5 5.5 1.7 7.5 8.2 3.0
17.3 12.8 24.8 13.1 17.7 17.9 18.1 17.3 12.9 17.5 19.0 18.7 16.5 10.9 19.0 39.9 36.2 .. 7.0 24.7 23.8 28.8 16.1 29.0 34.6 10.0 11.9 23.9 6.0 .. .. 7.4 30.6 .. 61.3 26.4 .. 22.3 5.9 .. 18.2 15.6 40.0 4.0 19.0 1.9 28.9 40.0 12.6
7.9 d .. 9.9 1.4 0.9 e .. .. ..
0.0 .. .. 0.0 .. .. .. 0.0
84 .. 45 126 126 .. 42 140
100.0 .. 99.0 100.0 .. .. .. 100.0
68.2 84.2 52.3 93.6 98.0 43.3 24.7 100.0
64.4 .. .. .. 88.0 .. .. 100.0
73.6 .. .. .. 100.0 .. .. 100.0
6.3 0.6 .. 8.8 3.5 .. .. 9.5
26.0 1.9 .. 48.7 21.0 .. .. 53.9