HUMAN DEVELOPMENT REPORT 2014 Sustaining Human Progress Reducing Vulnerabilities and Building Resilience
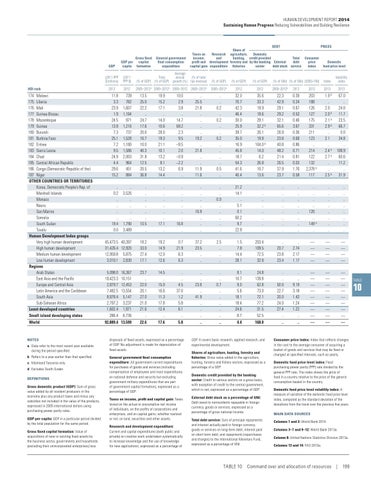
GDP
HDI rank
174 Malawi 175 Liberia 176 Mali 177 Guinea-Bissau 178 Mozambique 179 Guinea 180 Burundi 181 Burkina Faso 182 Eritrea 183 Sierra Leone 184 Chad 185 Central African Republic 186 Congo (Democratic Republic of the) 187 Niger OTHER COUNTRIES OR TERRITORIES Korea, Democratic People’s Rep. of Marshall Islands Monaco Nauru San Marino Somalia South Sudan Tuvalu Human Development Index groups Very high human development High human development Medium human development Low human development Regions Arab States East Asia and the Pacific Europe and Central Asia Latin America and the Caribbean South Asia Sub-Saharan Africa Least developed countries Small island developing states World
NOTES a Data refer to the most recent year available during the period specified. b Refers to a year earlier than that specified. c Mainland Tanzania only. d Excludes South Sudan. DEFINITIONS Gross domestic product (GDP): Sum of gross value added by all resident producers in the economy plus any product taxes and minus any subsidies not included in the value of the products, expressed in 2005 international dollars using purchasing power parity rates. GDP per capita: GDP in a particular period divided by the total population for the same period. Gross fixed capital formation: Value of acquisitions of new or existing fixed assets by the business sector, governments and households (excluding their unincorporated enterprises) less
Gross fixed GDP per capital capita formation
General government final consumption expenditure
DEBT PRICES Share of Taxes on Research agriculture, Domestic hunting, credit provided income, and Total Consumer profit and development forestry and by the banking External debt price Domestic capital gain expenditure fisheries sector index debt stock service food price level
(2011 PPP $ billions)
(2011 PPP $)
(% of GDP)
Average annual (% of total growth (%) tax revenue)
(% of GDP)
(% of GDP)
(% of GDP)
2012
2012
2005–2012a 2005–2012a 2005–2012 2005–2012a
2005–2012a
2012
Total (% of GDP)
(% of GNI) (% of GNI) (2005=100)
Index
Volatility index
2012
2005–2012a
2012
2012
2013
2013
35.6 33.3 19.9 18.6 28.1 32.2 b 26.1 19.8 104.0 b 14.0 6.2 26.8 10.7 13.6
22.3 42.9 29.1 29.2 32.1 65.6 26.9 23.8 40.8 48.2 21.4 26.5 37.9 23.7
0.39 0.24 0.67 0.53 0.46 3.67 0.36 0.68 0.86 0.71 0.81 0.03 1.76 0.58
203 188 126 127 175 331 211 123 .. 214 122 132 2,378 b 117 .. .. .. .. 120 .. 149 b ..
.. .. .. .. .. .. .. ..
.. .. .. .. .. .. .. ..
1.9 b .. 2.0 2.0 b 2.1 b 2.9 b .. 2.1 .. 2.4 b 2.7 b .. .. 2.5 b
11.8 3.3 23.9 1.9 24.5 13.9 7.3 25.1 7.2 9.5 24.9 4.4 29.6 15.2
739 782 1,607 1,164 971 1,216 737 1,528 1,180 1,586 2,003 964 451 884
13.5 25.0 22.2 .. 24.7 17.6 20.0 16.7 10.0 40.3 31.8 12.5 20.5 36.8
19.9 15.2 17.1 .. 14.0 10.6 28.0 19.3 21.1 10.1 13.2 8.1 13.2 14.4
10.0 2.9 3.8 .. 14.7 69.2 2.3 9.5 –9.5 2.0 –0.9 –2.2 6.9 ..
.. 25.5 21.8 .. .. .. .. 19.2 .. 21.8 .. .. 11.9 11.6
.. .. 0.2 .. 0.2 .. .. 0.2 .. .. .. .. 0.5 ..
32.0 70.7 42.3 46.4 30.0 25.9 39.7 35.0 16.9 45.8 18.7 54.3 41.6 40.4
.. 0.2 .. .. .. .. 19.4 0.0
.. 3,526 .. .. .. .. 1,790 3,489
.. .. .. .. .. .. 10.5 ..
.. .. .. .. .. .. 17.1 ..
.. .. .. .. .. .. 16.8 ..
.. .. .. .. 16.9 .. .. ..
.. .. 0.0 .. .. .. .. ..
21.2 14.1 .. 5.1 0.1 60.2 9.7 22.8
.. .. .. .. .. .. .. ..
.. .. .. .. .. .. .. ..
.. .. .. .. .. .. .. ..
45,473.5 40,397 31,426.4 12,920 12,959.8 5,875 3,010.1 2,830
18.2 33.0 27.4 17.1
19.2 14.9 12.0 12.6
0.7 21.9 6.3 6.3
37.2 23.5 .. ..
2.5 .. .. ..
1.5 7.8 14.4 28.1
203.4 109.5 72.5 32.8
.. 20.7 23.8 23.4
.. 2.74 2.17 1.17
— — — —
— — — —
— — — —
5,098.0 19,423.3 2,879.7 7,482.5 8,878.4 2,797.2 1,602.4
16,367 10,151 12,453 13,554 5,147 3,237 1,971
23.7 .. 22.0 20.1 27.0 21.0 21.6
14.5 .. 15.0 16.6 11.3 17.8 12.4
.. .. 4.5 37.0 1.2 5.8 6.1
.. .. 23.8 .. 41.9 .. ..
.. .. 0.7 .. .. .. ..
8.1 10.7 9.0 5.6 18.1 18.4 24.6
24.8 139.8 62.8 73.0 72.1 77.2 31.5
.. .. 50.0 22.7 20.0 24.0 27.4
.. .. 9.19 3.18 1.43 1.24 1.22
— — — — — — —
— — — — — — —
— — — — — — —
286.4
6,736
..
..
..
..
..
8.7
52.5
..
..
—
—
—
92,889.4 13,599
22.6
17.6
5.8
..
..
4.4
168.0
..
..
—
—
—
disposals of fixed assets, expressed as a percentage of GDP. No adjustment is made for depreciation of fixed assets. General government final consumption expenditure: All government current expenditures for purchases of goods and services (including compensation of employees and most expenditures on national defense and security but excluding government military expenditures that are part of government capital formation), expressed as a percentage of GDP. Taxes on income, profit and capital gain: Taxes levied on the actual or presumptive net income of individuals, on the profits of corporations and enterprises, and on capital gains, whether realized or not, on land, securities and other assets. Research and development expenditure: Current and capital expenditures (both public and private) on creative work undertaken systematically to increase knowledge and the use of knowledge for new applications, expressed as a percentage of
GDP. It covers basic research, applied research, and experimental development. Shares of agriculture, hunting, forestry and fisheries: Gross value added in the agriculture, hunting, forestry and fishery sectors, expressed as a percentage of a GDP. Domestic credit provided by the banking sector: Credit to various sectors on a gross basis, with exception of credit to the central government, which is net, expressed as a percentage of GDP. External debt stock as a percentage of GNI: Debt owed to nonresidents repayable in foreign currency, goods or services, expressed as a percentage of gross national income. Total debt service: Sum of principal repayments and interest actually paid in foreign currency, goods or services on long-term debt; interest paid on short-term debt; and repayments (repurchases and charges) to the International Monetary Fund, expressed as a percentage of GNI.
67.0 .. 24.0 11.7 23.5 66.7 0.0 34.8 .. 108.9 60.6 11.2 .. 31.9
Consumer price index: Index that reflects changes in the cost to the average consumer of acquiring a basket of goods and services that may be fixed or changed at specified intervals, such as yearly. Domestic food price level index: Food purchasing power parity (PPP) rate divided by the general PPP rate. The index shows the price of food in a country relative to the price of the generic consumption basket in the country. Domestic food price level volatility index: A measure of variation of the domestic food price level index, computed as the standard deviation of the deviations from the trend over the previous five years. MAIN DATA SOURCES Columns 1 and 2: World Bank 2014. Columns 3–7 and 9–12: World Bank 2013a. Column 8: United Nations Statistics Division 2013a. Columns 13 and 14: FAO 2013a.
TABLE 10 Command over and allocation of resources | 199
TABLE
10