HUMAN DEVELOPMENT REPORT 2014 Sustaining Human Progress Reducing Vulnerabilities and Building Resilience
GDP
HDI rank
Gross fixed GDP per capital capita formation
General government final consumption expenditure
DEBT PRICES Share of Taxes on Research agriculture, Domestic hunting, credit provided income, and Total Consumer profit and development forestry and by the banking External debt price Domestic capital gain expenditure fisheries sector index debt stock service food price level
(2011 PPP $ billions)
(2011 PPP $)
(% of GDP)
Average annual (% of total growth (%) tax revenue)
(% of GDP)
(% of GDP)
(% of GDP)
2012
2012
2005–2012a 2005–2012a 2005–2012 2005–2012a
2005–2012a
2012
58 Bulgaria 115.0 59 Barbados 4.3 b 60 Palau 0.3 61 Antigua and Barbuda 1.8 62 Malaysia 640.3 63 Mauritius 20.9 64 Trinidad and Tobago 38.9 65 Lebanon 73.1 65 Panama 63.3 67 Venezuela (Bolivarian Republic of) 528.5 68 Costa Rica 62.9 69 Turkey 1,344.3 70 Kazakhstan 361.1 71 Mexico 1,950.9 71 Seychelles 2.0 73 Saint Kitts and Nevis 1.1 73 Sri Lanka 180.1 75 Iran (Islamic Republic of) 1,181.6 b 76 Azerbaijan 147.7 77 Jordan 71.6 77 Serbia 83.7 79 Brazil 2,840.9 79 Georgia 30.0 79 Grenada 1.2 82 Peru 347.9 83 Ukraine 379.9 84 Belize 2.7 b 84 The former Yugoslav Republic of Macedonia 24.7 86 Bosnia and Herzegovina 35.2 87 Armenia 21.6 88 Fiji 6.6 89 Thailand 907.3 90 Tunisia 114.4 91 China 14,548.6 91 Saint Vincent and the Grenadines 1.1 93 Algeria 491.7 93 Dominica 0.7 95 Albania 29.2 96 Jamaica 22.8 b 97 Saint Lucia 1.9 98 Colombia 557.5 98 Ecuador 153.4 100 Suriname 8.1 100 Tonga 0.5 102 Dominican Republic 113.2 MEDIUM HUMAN DEVELOPMENT 103 Maldives 3.8 103 Mongolia 23.2 103 Turkmenistan 64.5 106 Samoa 0.9 107 Palestine, State of .. 108 Indonesia 2,186.3 109 Botswana 28.9 110 Egypt 862.5 111 Paraguay 48.3 112 Gabon 29.4 113 Bolivia (Plurinational State of) 59.3 114 Moldova (Republic of) 14.8 115 El Salvador 46.9
Total (% of GDP)
(% of GNI) (% of GNI) (2005=100)
Index
Volatility index
2012
2005–2012a
2012
2012
2013
2013
15,738 15,299 b 14,411 19,714 21,897 16,194 29,086 16,509 16,655 17,642 13,091 18,167 21,506 16,144 23,152 20,895 8,862 15,461 b 15,888 11,340 11,587 14,301 6,691 11,786 11,603 8,332 8,438 b 11,708 9,184 7,291 7,552 13,586 10,612 10,771 10,271 12,779 9,629 9,243 8,421 b 10,242 11,687 9,900 15,174 5,127 11,016
21.4 14.6 .. 29.3 25.6 24.0 9.7 31.2 27.7 20.3 20.2 20.3 20.6 20.7 .. 29.9 27.1 25.8 22.5 25.2 26.3 18.1 21.8 21.9 26.6 18.9 25.4 20.6 21.9 31.3 20.7 28.5 22.7 46.1 25.2 38.3 22.8 25.3 20.8 35.7 23.6 26.6 24.9 30.7 16.3
7.8 20.3 .. 17.8 13.5 13.5 9.5 14.5 11.2 12.2 17.9 14.8 11.6 11.5 .. 10.4 14.8 11.2 10.3 16.5 18.9 21.5 17.7 17.1 10.3 19.4 15.8 18.3 23.0 11.9 14.8 13.6 13.8 13.5 16.2 14.2 17.6 8.2 16.0 16.6 16.1 13.5 23.3 17.1 8.1
–0.4 .. .. .. 5.0 2.3 –0.6 6.9 18.1 6.3 1.7 5.7 11.3 1.5 .. .. 6.3 –4.3 10.2 –13.5 –2.2 3.2 .. .. 9.4 2.4 5.1 –2.8 1.7 14.2 .. 7.5 3.3 9.7 .. 6.6 .. 7.6 .. .. 770.6 7.7 .. .. 11.5
15.5 31.6 .. .. 52.0 18.2 47.5 17.2 .. 21.5 15.5 25.5 36.5 .. 31.5 6.8 16.6 19.3 18.1 12.3 8.8 28.4 35.2 15.2 34.5 12.8 29.8 12.7 6.6 19.4 32.5 38.0 29.0 23.1 23.6 60.2 .. .. 31.4 .. 22.0 .. .. .. 18.7
0.6 .. .. .. 0.6 0.4 0.1 .. 0.2 .. 0.5 0.8 0.2 0.4 0.3 .. 0.1 0.8 0.2 0.4 0.9 1.2 0.2 .. .. 0.9 .. 0.2 0.0 0.3 .. 0.2 1.1 1.7 .. 0.1 .. 0.2 .. .. 0.2 0.3 .. .. ..
6.4 1.6 6.1 2.1 10.2 3.5 0.4 5.0 3.5 5.7 5.9 8.9 4.5 3.5 2.6 1.6 11.1 9.3 5.5 3.0 10.2 5.2 8.3 5.6 7.0 8.9 12.4 10.3 8.4 20.9 12.2 10.4 8.9 10.1 7.1 8.8 14.6 20.4 6.4 2.9 6.5 9.4 9.1 18.8 5.9
71.0 136.3 b .. 94.5 134.5 113.6 36.5 176.4 89.0 42.0 53.3 71.9 41.8 47.1 38.8 108.2 48.4 18.0 b 24.7 113.4 62.4 110.5 35.0 92.4 17.8 80.2 66.9 b 48.8 67.0 44.4 117.1 168.9 82.2 152.7 56.8 –2.1 63.4 67.0 51.5 134.7 69.6 24.3 b 26.9 27.2 46.4
77.9 .. .. .. 34.8 12.5 .. 61.7 43.7 21.8 25.7 40.1 77.9 25.2 184.4 .. 41.0 .. 14.9 61.5 71.8 16.6 79.1 73.8 25.8 83.3 96.0 62.8 58.6 68.3 23.6 24.0 50.4 9.4 42.1 3.4 59.9 46.0 98.8 37.6 24.3 25.1 .. 43.5 28.8
8.75 .. .. .. 3.87 1.43 .. 13.36 2.80 2.00 3.98 7.36 20.49 3.69 3.43 .. 2.24 0.74 3.32 3.25 12.34 2.43 11.46 3.41 2.03 17.02 9.99 9.24 4.71 8.66 5.19 3.14 6.03 1.07 4.47 0.35 3.63 2.97 11.87 3.76 3.15 3.15 .. 1.34 2.80
148 151 .. 120 120 152 178 118 137 249 173 178 184 134 203 133 196 316 179 147 183 141 154 127 123 212 116 124 125 145 144 124 134 125 131 139 121 122 205 123 134 137 179 141 153
1.3 b .. .. .. 1.6 1.8 b .. .. .. 2.3 .. 1.9 .. 1.3 .. .. 1.8 b 2.6 b 1.9 b 1.3 .. 1.3 b .. .. 1.7 1.2 b .. 1.6 b 1.7 b 1.9 1.4 b 1.9 1.8 2.0 b .. .. .. 1.7 .. .. 1.7 1.6 .. .. ..
39.3 .. .. .. 7.6 71.4 .. .. .. 82.1 .. 81.7 15.0 6.7 .. .. 33.9 58.6 66.4 20.5 .. 25.2 7.2 .. 9.1 70.6 .. 38.8 17.5 51.0 19.3 16.4 19.3 65.9 .. .. .. 22.8 .. .. 30.3 13.1 .. .. ..
11,270 8,288 12,460 4,935 .. 8,856 14,443 10,685 7,215 17,997 5,650 4,146 7,445
40.4 51.7 54.1 .. 25.7 33.1 36.1 16.0 14.7 25.9 18.2 23.4 14.2
16.8 14.1 9.5 .. 32.6 8.9 19.3 11.6 12.2 8.9 13.5 20.6 11.2
.. 9.4 .. .. 8.5 2.3 2.2 3.1 21.0 13.6 4.9 11.1 2.5
3.1 15.3 .. .. 2.1 35.6 28.5 29.7 13.8 .. 9.6 1.0 24.3
.. 0.2 .. .. .. 0.1 0.5 0.2 0.1 0.6 0.2 0.5 0.1
4.1 17.1 13.8 9.8 5.6 14.4 3.0 14.8 20.9 2.7 12.3 12.8 11.4
70.3 30.8 .. 45.7 .. 42.6 14.9 79.3 37.2 13.0 48.7 42.2 66.1
50.2 32.7 2.0 58.5 .. 26.0 13.8 15.7 25.7 19.7 27.6 72.0 53.5
5.12 1.44 0.49 1.95 .. 3.80 0.46 1.51 1.83 2.48 2.00 6.18 5.52
174 211 .. 141 119 b 160 181 204 157 117 157 173 127
1.7 b 1.8 b .. .. .. 2.0 2.0 2.0 1.7 2.5 b 1.6 b 1.5 ..
55.4 59.0 .. .. .. 23.5 64.6 102.7 66.7 19.7 35.9 46.8 ..
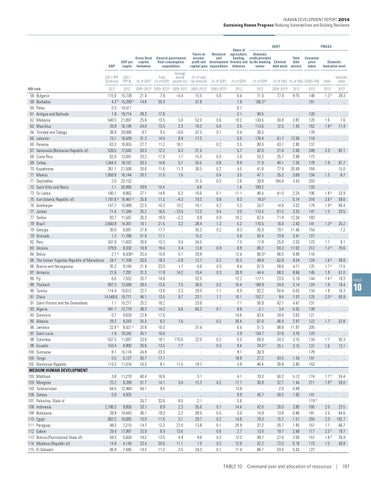
TABLE 10 Command over and allocation of resources | 197
TABLE
10