HUMAN DEVELOPMENT REPORT 2014 Sustaining Human Progress Reducing Vulnerabilities and Building Resilience
Literacy rates
HDI rank
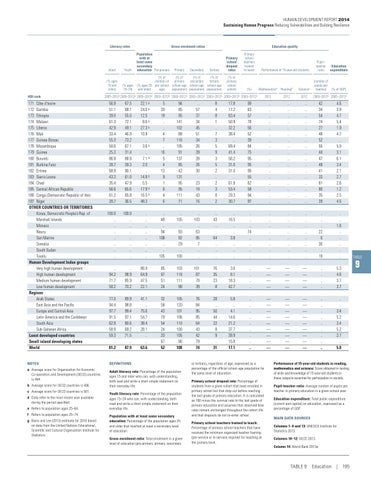
171 Côte d'Ivoire 172 Gambia 173 Ethiopia 174 Malawi 175 Liberia 176 Mali 177 Guinea-Bissau 178 Mozambique 179 Guinea 180 Burundi 181 Burkina Faso 182 Eritrea 183 Sierra Leone 184 Chad 185 Central African Republic 186 Congo (Democratic Republic of the) 187 Niger OTHER COUNTRIES OR TERRITORIES Korea, Democratic People’s Rep. of Marshall Islands Monaco Nauru San Marino Somalia South Sudan Tuvalu Human Development Index groups Very high human development High human development Medium human development Low human development Regions Arab States East Asia and the Pacific Europe and Central Asia Latin America and the Caribbean South Asia Sub-Saharan Africa Least developed countries Small island developing states World
Adult
Youth
(% ages 15 and older)
(% ages 15–24)
Gross enrolment ratios Population with at least some secondary education Pre-primary
Primary
g
f Refers to population ages 25–74. g Barro and Lee (2013) estimate for 2010 based on data from the United Nations Educational, Scientific and Cultural Organization Institute for Statistics.
(%)
Mathematicsa Readingb
Education expenditure
Sciencec
(number of pupils per teacher) (% of GDP) 2003–2012d 2005–2012d
2012
2012
2012
67.5 68.1 55.0 72.1 49.1 46.9 73.2 67.1 31.4 88.9 39.3 90.1 61.0 47.9 65.6 65.8 36.5
22.1 24.0 g 12.5 8.6 g 27.3 g 10.9 .. 3.6 g .. 7.1 g 2.0 .. 14.8 g 5.5 17.9 g 16.5 g 48.3
5 30 18 .. .. 4 7 .. 16 5 4 13 9 1 6 4 6
94 85 95 141 102 88 116 105 91 137 85 42 131 95 95 111 71
.. 57 37 34 45 51 34 26 39 28 26 30 .. 23 18 43 16
8 4 8 1 .. 7 3 5 9 3 5 2 .. 2 3 8 2
17.8 17.2 63.4 50.9 32.2 38.4 .. 69.4 41.4 56.2 31.0 31.0 .. 61.9 53.4 29.3 30.7
99 63 57 78 56 52 39 84 75 95 95 90 55 62 58 94 97
.. .. .. .. .. .. .. .. .. .. .. .. .. .. .. .. ..
.. .. .. .. .. .. .. .. .. .. .. .. .. .. .. .. ..
.. .. .. .. .. .. .. .. .. .. .. .. .. .. .. .. ..
42 34 54 74 27 48 52 55 44 47 48 41 33 61 80 35 39
4.6 3.9 4.7 5.4 1.9 4.7 .. 5.0 3.1 6.1 3.4 2.1 2.7 2.6 1.2 2.5 4.5
100.0 .. .. .. .. .. .. ..
100.0 .. .. .. .. .. .. ..
.. .. .. .. .. .. .. ..
.. 48 .. 94 108 .. .. 105
.. 105 .. 93 92 29 .. 100
.. 103 .. 63 95 7 .. ..
.. 43 .. .. 64 .. .. ..
.. 16.5 .. .. 3.8 .. .. ..
.. .. .. 74 .. .. .. ..
.. .. .. .. .. .. .. ..
.. .. .. .. .. .. .. ..
.. .. .. .. .. .. .. ..
.. .. .. 22 6 36 .. 19
.. .. 1.6 .. .. .. .. ..
.. 94.2 71.7 58.2
.. 98.9 85.9 70.2
86.9 64.9 47.5 22.1
85 67 51 24
103 118 111 98
101 87 70 39
76 35 23 8
3.6 8.1 18.3 42.7
.. .. .. ..
— — — —
— — — —
— — — —
.. .. .. ..
5.3 4.6 3.7 3.7
77.0 94.4 97.7 91.5 62.9 58.9 59.3 .. 81.2
89.9 98.8 99.4 97.1 80.6 69.2 71.5 .. 87.9
41.1 .. 75.6 54.7 38.4 28.1 .. .. 63.6
32 58 43 79 54 24 20 67 52
105 120 101 106 110 100 105 96 108
76 84 95 85 64 43 42 79 74
28 .. 50 44 22 8 9 .. 31
5.8 .. 4.1 14.6 21.2 37.7 39.9 15.8 17.1
.. .. .. .. .. .. .. .. ..
— — — — — — — — —
— — — — — — — — —
— — — — — — — — —
.. .. .. .. .. .. .. .. ..
.. .. 3.4 5.2 3.4 5.2 3.7 .. 5.0
Adult literacy rate: Percentage of the population ages 15 and older who can, with understanding, both read and write a short simple statement on their everyday life.
e Refers to population ages 25–64.
(% of primary school cohort)
Pupil– teacher ratio
Performance of 15-year-old students
56.9 51.1 39.0 61.3 42.9 33.4 55.3 50.6 25.3 86.9 28.7 68.9 43.3 35.4 56.6 61.2 28.7
DEFINITIONS
d Data refer to the most recent year available during the period specified.
Primary school dropout rates
2005–2012d 2005–2012d 2005–2012d 2003–2012d 2003–2012d 2003–2012d 2003–2012d 2003–2012d 2003–2012d
a Average score for Organisation for Economic Co-operation and Development (OECD) countries is 494. c Average score for OECD countries is 501.
Tertiary
(% of (% of (% of (% of children of primary secondary tertiary (% ages 25 pre-school school-age school-age school-age age) population) population) population) and older)
NOTES
b Average score for OECD countries is 496.
Secondary
Education quality Primary school teachers trained to teach
Youth literacy rate: Percentage of the population ages 15–24 who can, with understanding, both read and write a short simple statement on their everyday life. Population with at least some secondary education: Percentage of the population ages 25 and older that reached at least a secondary level of education. Gross enrolment ratio: Total enrolment in a given level of education (pre-primary, primary, secondary
or tertiary), regardless of age, expressed as a percentage of the official school-age population for the same level of education. Primary school dropout rate: Percentage of students from a given cohort that have enrolled in primary school but that drop out before reaching the last grade of primary education. It is calculated as 100 minus the survival rate to the last grade of primary education and assumes that observed flow rates remain unchanged throughout the cohort life and that dropouts do not re-enter school. Primary school teachers trained to teach: Percentage of primary school teachers that have received the minimum organized teacher training (pre-service or in-service) required for teaching at the primary level.
Performance of 15-year-old students in reading, mathematics and science: Score obtained in testing of skills and knowledge of 15-year-old students in these subjects essential for participation in society. Pupil-teacher ratio: Average number of pupils per teacher in primary education in a given school year. Education expenditure: Total public expenditure (current and capital) on education, expressed as a percentage of GDP. MAIN DATA SOURCES Columns 1–9 and 13: UNESCO Institute for Statistics 2013. Columns 10–12: OECD 2013. Column 14: World Bank 2013a.
TABLE 9 Education | 195
TABLE
9