HUMAN DEVELOPMENT REPORT 2014 Sustaining Human Progress Reducing Vulnerabilities and Building Resilience
Adult mortality rate
Age-standardized death rates
(per 1,000 people)
(per 100,000 people)
From alcohol use From drug use
(% of GDP)
(% of total health expenditure)
2010/2015a
2010
2010
2003–2012b
2011
2011
17.0 15.4 15.4 14.9 16.8 14.8 16.0 15.1 15.1 12.5 15.6 15.9 15.2 15.5
46.4 47.9 48.4 49.5 46.1 50.6 46.8 48.8 52.0 50.7 48.6 41.7 48.1 49.4
43.7 47.6 48.8 46.7 42.9 49.8 45.5 45.4 50.3 47.6 45.1 37.7 44.7 48.5
0.2 0.1 0.8 0.7 0.3 1.0 0.3 0.5 0.5 0.2 0.4 0.5 1.1 0.2
8.4 19.5 6.8 6.3 6.6 6.0 8.7 6.5 2.6 18.8 4.3 3.8 8.5 5.3
14.2 17.7 54.3 41.3 9.0 67.4 43.6 36.6 51.2 74.9 70.5 43.4 43.5 37.6
0.6 0.2 .. .. .. 6.4 .. 0.1
3.8 46.5 .. 71.1 .. 5.3 .. ..
.. .. .. .. .. 0.5 2.7 ..
16.8 .. .. .. .. 16.1 16.4 ..
64.4 55.8 .. .. .. 48.2 .. ..
60.3 53.1 .. .. .. 46.8 .. ..
32.9 4.4 70.6 7.1 48.8 0.4 .. 10.9
.. 16.5 4.4 .. 7.2 .. 1.6 17.3
.. 12.6 7.0 8.0 14.7 .. 55.4 0.1
1.9 1.6 1.3 0.9
1.0 0.9 2.3 2.9
22.0 12.5 5.9 5.4
.. .. .. ..
23.0 19.9 18.5 16.2
70.9 68.6 59.5 53.0
66.9 63.6 56.3 50.7
27.8 17.2 7.4 2.8
12.2 6.0 4.6 5.2
13.7 33.8 44.7 52.7
0.7 1.0 2.3 3.4 1.1 0.9 1.0 3.0 1.4
6.6 0.4 1.4 0.8 3.2 0.6 2.7 0.3 1.7
25.5 5.6 23.1 23.6 3.2 7.6 3.6 18.6 11.6
.. .. .. .. .. .. .. .. ..
19.0 18.5 18.7 21.2 18.6 16.6 16.8 19.3 20.7
61.8 68.2 64.8 66.8 58.3 51.6 53.7 57.1 63.7
60.0 63.5 58.9 62.0 55.5 49.4 51.3 52.5 59.8
13.7 12.1 26.2 .. 6.3 1.8 1.7 25.5 13.4
4.3 4.8 6.3 7.6 4.2 6.3 5.6 5.6 10.1
31.1 35.9 28.5 34.4 59.7 27.6 48.2 33.6 17.8
2008
0.8 0.9 0.9 0.9 0.7 0.9 0.9 0.9 0.6 1.2 1.0 0.9 0.9 1.1
0.3 0.3 0.3 0.3 0.3 0.3 0.2 0.3 0.2 0.0 0.3 0.2 0.2 0.3
131 392 51 57 46 316 344 283
203 433 110 105 56 399 378 251
0.8 0.2 2.0 0.9 .. 2.1 .. 0.2
59 89 157 270
109 152 230 313
111 99 104 98 153 327 246 155 127
160 137 216 181 228 372 289 206 188
Age-standardized death rate from alcohol use: The weighted average of the age-specific mortality rates from alcohol use per 100,000 people, where the weights are the proportions of people in the
(per 10,000 people)
2012
2008
384 331 369 405 457 348 370 298 347 459 373 466 411 312
Adult mortality rate: Probability that a 15-year-old will die before reaching age 60, expressed per 1,000 people.
Male
10.8 0.9 0.9 3.9 11.1 1.7 1.3 1.0 0.7 1.5 2.7 .. 1.1 0.5
2011
347 292 304 352 421 294 321 236 259 438 311 420 358 272
DEFINITIONS
Out of pocket
4.5 5.5 4.8 5.4 5.4 4.7 3.3 2.4 1.8 7.0 3.1 3.7 1.9 2.5
2011
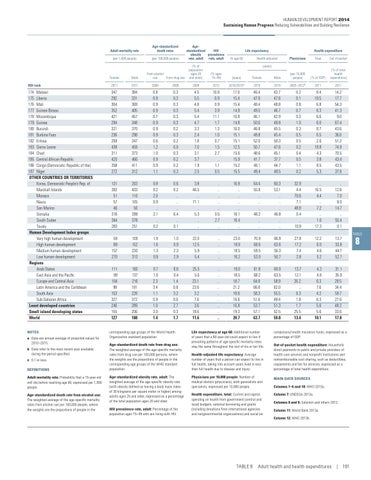
174 Malawi 175 Liberia 176 Mali 177 Guinea-Bissau 178 Mozambique 179 Guinea 180 Burundi 181 Burkina Faso 182 Eritrea 183 Sierra Leone 184 Chad 185 Central African Republic 186 Congo (Democratic Republic of the) 187 Niger OTHER COUNTRIES OR TERRITORIES Korea, Democratic People’s Rep. of Marshall Islands Monaco Nauru San Marino Somalia South Sudan Tuvalu Human Development Index groups Very high human development High human development Medium human development Low human development Regions Arab States East Asia and the Pacific Europe and Central Asia Latin America and the Caribbean South Asia Sub-Saharan Africa Least developed countries Small island developing states World
c 0.1 or less.
Total
(years)
2008
HDI rank
b Data refer to the most recent year available during the period specified.
Health expenditure Physicians
Health-adjusted
(years)
Male
a Data are annual average of projected values for 2010–2015.
(% of population ages 20 and older)
Life expectancy At age 60
(% ages 15–49)
Female
NOTES
Agestandardized HIV obesity prevalence rate, adult rate, adult
corresponding age groups of the World Health Organization standard population. Age-standardized death rate from drug use: The weighted average of the age-specific mortality rates from drug use per 100,000 persons, where the weights are the proportions of people in the corresponding age groups of the WHO standard population. Age-standardized obesity rate, adult: The weighted average of the age-specific obesity rate (with obesity defined as having a body mass index of 30 kilograms per square meter or higher) among adults ages 20 and older, expressed as a percentage of the total population ages 20 and older. HIV prevalence rate, adult: Percentage of the population ages 15–49 who are living with HIV.
Female
Life expectancy at age 60: Additional number of years that a 60-year-old could expect to live if prevailing patterns of age-specific mortality rates stay the same throughout the rest of his or her life. Health-adjusted life expectancy: Average number of years that a person can expect to live in full health, taking into account years lived in less than full health due to disease and injury.
compulsory) health insurance funds, expressed as a percentage of GDP. Out-of-pocket health expenditure: Household direct payments to public and private providers of health care services and nonprofit institutions and nonreimbursable cost sharing, such as deductibles, copayments and fee for services, expressed as a percentage of total health expenditure.
Physicians per 10,000 people: Number of medical doctors (physicians), both generalists and specialists, expressed per 10,000 people.
MAIN DATA SOURCES
Health expenditure, total: Current and capital spending on health from government (central and local) budgets, external borrowing and grants (including donations from international agencies and nongovernmental organizations) and social (or
Column 7: UNDESA 2013a.
Columns 1–6 and 10: WHO 2013a.
Columns 8 and 9: Salomon and others 2012. Column 11: World Bank 2013a. Column 12: WHO 2013b.
TABLE 8 Adult health and health expenditures | 191
TABLE
8