THE BIG PICTURE
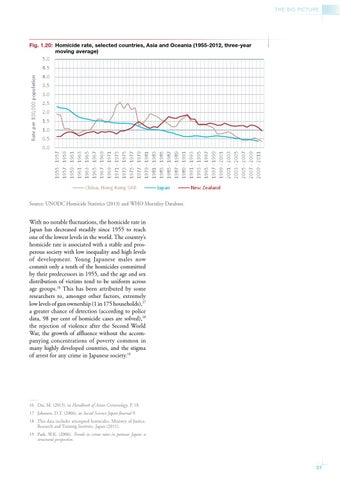
Fig. 1.20: Homicide rate, selected countries, Asia and Oceania (1955-2012, three-year moving average) 5.0
Rate per 100,000 population
4.5 4.0 3.5 3.0 2.5 2.0 1.5 1.0 0.5 1955 - 1957 1957 - 1959 1959 - 1961 1961 - 1963 1963 - 1965 1965 - 1967 1967 - 1969 1969 - 1971 1971 - 1973 1973 - 1975 1975 - 1977 1977 - 1979 1979 - 1981 1981 - 1983 1983 - 1985 1985 - 1987 1987 - 1989 1989 - 1991 1991 - 1993 1993 - 1995 1995 - 1997 1997 - 1999 1999 - 2001 2001 - 2003 2003 - 2005 2005 - 2007 2007 - 2009 2009 - 2011
0.0
China, Hong Kong SAR
Japan
New Zealand
Source: UNODC Homicide Statistics (2013) and WHO Mortality Database.
With no notable fluctuations, the homicide rate in Japan has decreased steadily since 1955 to reach one of the lowest levels in the world. The country’s homicide rate is associated with a stable and prosperous society with low inequality and high levels of development. Young Japanese males now commit only a tenth of the homicides committed by their predecessors in 1955, and the age and sex distribution of victims tend to be uniform across age groups.16 This has been attributed by some researchers to, amongst other factors, extremely low levels of gun ownership (1 in 175 households),17 a greater chance of detection (according to police data, 98 per cent of homicide cases are solved),18 the rejection of violence after the Second World War, the growth of affluence without the accompanying concentrations of poverty common in many highly developed countries, and the stigma of arrest for any crime in Japanese society.19
16 Dai, M. (2013), in Handbook of Asian Criminology. P. 18. 17 Johnson, D.T. (2006), in Social Science Japan Journal 9. 18 This data includes attempted homicides. Ministry of Justice, Research and Training Institute, Japan (2011). 19 Park, W.K. (2006). Trends in crime rates in postwar Japan: a structural perspective.
37