GLOBAL STUDY on Homicide
Italy: years of terrorism and Mafia-related violence in the early 1980s and early 1990s) as well as in the overall trends of individual countries such as Finland and Hungary, two countries that have had parallel homicide trends but for two periods of major political change that affected Hungary (the civil revolution in 1956 and the regime transition in the early 1990s).
The few countries/territories in Asia and Oceania for which long-term data are available have been characterised by very stable social and economic situations, which are reflected in low homicide levels, although there have been some fluctuations in the case of Hong Kong, China and New Zealand, mostly due to low numbers of homicide victims and small population sizes (see figure 1.20).
85 80 75 70 65 60 55 50 45 40 35 30 25 20 15 10 5 0 1955 - 1957 1957 - 1959 1959 - 1961 1961 - 1963 1963 - 1965 1965 - 1967 1967 - 1969 1969 - 1971 1971 - 1973 1973 - 1975 1975 - 1977 1977 - 1979 1979 - 1981 1981 - 1983 1983 - 1985 1985 - 1987 1987 - 1989 1989 - 1991 1991 - 1993 1993 - 1995 1995 - 1997 1997 - 1999 1999 - 2001 2001 - 2003 2003 - 2005 2005 - 2007 2007 - 2009 2009 - 2011
Rate per 100,000 population
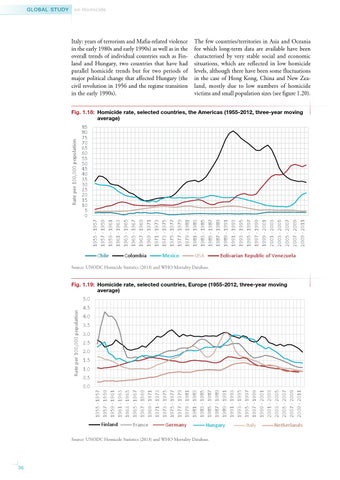
Fig. 1.18: Homicide rate, selected countries, the Americas (1955-2012, three-year moving average)
Chile
Colombia
Mexico
USA
Bolivarian Republic of Venezuela
Source: UNODC Homicide Statistics (2013) and WHO Mortality Database.
Fig. 1.19: Homicide rate, selected countries, Europe (1955-2012, three-year moving average)
Rate per 100,000 population
5.0 4.5 4.0 3.5 3.0 2.5 2.0 1.5 1.0 0.5 1955 - 1957 1957 - 1959 1959 - 1961 1961 - 1963 1963 - 1965 1965 - 1967 1967 - 1969 1969 - 1971 1971 - 1973 1973 - 1975 1975 - 1977 1977 - 1979 1979 - 1981 1981 - 1983 1983 - 1985 1985 - 1987 1987 - 1989 1989 - 1991 1991 - 1993 1993 - 1995 1995 - 1997 1997 - 1999 1999 - 2001 2001 - 2003 2003 - 2005 2005 - 2007 2007 - 2009 2009 - 2011
0.0
Finland
France
Germany
Hungary
Source: UNODC Homicide Statistics (2013) and WHO Mortality Database.
36
Italy
Netherlands