THE BIG PICTURE
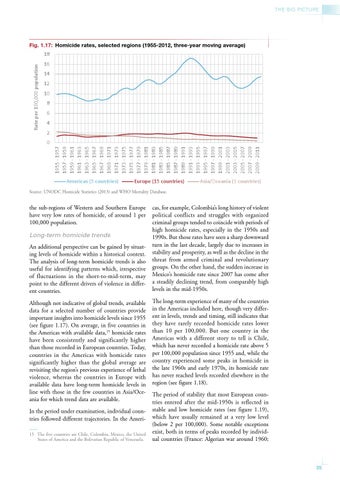
Fig. 1.17: Homicide rates, selected regions (1955-2012, three-year moving average)
Rate per 100,000 population
18 16 14 12 10 8 6 4 2 1955 - 1957 1957 - 1959 1959 - 1961 1961 - 1963 1963 - 1965 1965 - 1967 1967 - 1969 1969 - 1971 1971 - 1973 1973 - 1975 1975 - 1977 1977 - 1979 1979 - 1981 1981 - 1983 1983 - 1985 1985 - 1987 1987 - 1989 1989 - 1991 1991 - 1993 1993 - 1995 1995 - 1997 1997 - 1999 1999 - 2001 2001 - 2003 2003 - 2005 2005 - 2007 2007 - 2009 2009 - 2011
0
Americas (5 countries)
Europe (15 countries)
Asia/Oceania (3 countries)
Source: UNODC Homicide Statistics (2013) and WHO Mortality Database.
the sub-regions of Western and Southern Europe have very low rates of homicide, of around 1 per 100,000 population.
Long-term homicide trends An additional perspective can be gained by situating levels of homicide within a historical context. The analysis of long-term homicide trends is also useful for identifying patterns which, irrespective of fluctuations in the short-to-mid-term, may point to the different drivers of violence in different countries. Although not indicative of global trends, available data for a selected number of countries provide important insights into homicide levels since 1955 (see figure 1.17). On average, in five countries in the Americas with available data,15 homicide rates have been consistently and significantly higher than those recorded in European countries. Today, countries in the Americas with homicide rates significantly higher than the global average are revisiting the region’s previous experience of lethal violence, whereas the countries in Europe with available data have long-term homicide levels in line with those in the few countries in Asia/Oceania for which trend data are available. In the period under examination, individual countries followed different trajectories. In the Ameri15 The five countries are Chile, Colombia, Mexico, the United States of America and the Bolivarian Republic of Venezuela.
cas, for example, Colombia’s long history of violent political conflicts and struggles with organized criminal groups tended to coincide with periods of high homicide rates, especially in the 1950s and 1990s. But those rates have seen a sharp downward turn in the last decade, largely due to increases in stability and prosperity, as well as the decline in the threat from armed criminal and revolutionary groups. On the other hand, the sudden increase in Mexico’s homicide rate since 2007 has come after a steadily declining trend, from comparably high levels in the mid-1950s. The long-term experience of many of the countries in the Americas included here, though very different in levels, trends and timing, still indicates that they have rarely recorded homicide rates lower than 10 per 100,000. But one country in the Americas with a different story to tell is Chile, which has never recorded a homicide rate above 5 per 100,000 population since 1955 and, while the country experienced some peaks in homicide in the late 1960s and early 1970s, its homicide rate has never reached levels recorded elsewhere in the region (see figure 1.18). The period of stability that most European countries entered after the mid-1950s is reflected in stable and low homicide rates (see figure 1.19), which have usually remained at a very low level (below 2 per 100,000). Some notable exceptions exist, both in terms of peaks recorded by individual countries (France: Algerian war around 1960;
35