THE BIG PICTURE
Fig. 1.10: Male homicide rate, by age group, selected countries, Americas (2012 or latest year)
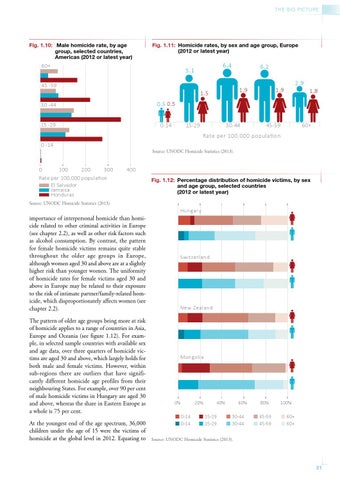
Fig. 1.11: Homicide rates, by sex and age group, Europe (2012 or latest year)
60+
6.4
5.1
6.2
45 -59
1.9
1.5 30 -44
0.5 0.5
15 -29
0-14
15-29
30-44
2.9
1.9
1.8
45-59
60+
Rate per 100,000 population 0 -14 Source: UNODC Homicide Statistics (2013).
0 100 200 300 Rate per 100,000 population El Salvador Jamaica Honduras
400 Fig. 1.12: Percentage distribution of homicide victims, by sex and age group, selected countries (2012 or latest year)
Source: UNODC Homicide Statistics (2013).
Hungary
importance of interpersonal homicide than homicide related to other criminal activities in Europe (see chapter 2.2), as well as other risk factors such as alcohol consumption. By contrast, the pattern for female homicide victims remains quite stable throughout the older age groups in Europe, although women aged 30 and above are at a slightly higher risk than younger women. The uniformity of homicide rates for female victims aged 30 and above in Europe may be related to their exposure to the risk of intimate partner/family-related homicide, which disproportionately affects women (see chapter 2.2). The pattern of older age groups being more at risk of homicide applies to a range of countries in Asia, Europe and Oceania (see figure 1.12). For example, in selected sample countries with available sex and age data, over three quarters of homicide victims are aged 30 and above, which largely holds for both male and female victims. However, within sub-regions there are outliers that have significantly different homicide age profiles from their neighbouring States. For example, over 90 per cent of male homicide victims in Hungary are aged 30 and above, whereas the share in Eastern Europe as a whole is 75 per cent. At the youngest end of the age spectrum, 36,000 children under the age of 15 were the victims of homicide at the global level in 2012. Equating to
Switzerland
New Zealand
Mongolia
0%
20% 0-14 0-14
40% 15-29 15-29
60% 30-44 30-44
80% 45-59 45-59
100% 60+ 60+
Source: UNODC Homicide Statistics (2013).
31