GLOBAL STUDY on Homicide
Criminal justice versus public health sources Data on homicide stem predominantly from two main types of source. “Criminal justice” data on homicide are typically recorded by the police, based on information collected when they receive or investigate details about a crime. Depending on national legislation and practices, data on homicide can be directly generated by police forces or public prosecutors. “Public health” data reflect information collected by the public health or medical service of a country and, at the global level, from a dataset produced by the World Health Organization (WHO). In countries with accurate registration systems, the two sources provide very similar results, but discrepancies do exist where coverage and quality of administrative records are poor. UNODC homicide estimates are built by selecting a source at the country level as the basis for sub-regional, regional and global estimates (see Methodological annex). The discrepancy between criminal justice and public health data is used to create the high-low estimates represented by the range intervals in the graphs depicting regional homicide counts and rates.
The sub-regional and national picture With averages of over 25 victims per 100,000 population, Southern Africa and Central America are the sub-regions with the highest homicide rates on record, followed by South America, Middle Africa and the Caribbean, with average rates of between 16 and 23 homicides per 100,000 population (see figure 1.3). This sub-regional picture has hardly changed since 2011. Likewise, as discussed later in this chapter, the fact that homicide rates are significantly higher in the Americas in comparison to other regions is not a new phenomenon. Indeed, according to available time series since 1955, the Americas have consistently experienced homicide levels five to eight times higher than those in Europe or Asia (see figure 1.17, page 35). In addition to the entire region of Oceania, subregions with relatively low rates of homicide (less than 3 per 100,000 population) include all the sub-regions of Europe (with the exception of Eastern Europe, which has a medium rate of homicide) and Eastern Asia. Sub-regional averages can, however, hide disparities in homicide rates at the national level. As map 1.1 demonstrates, for example, countries in the southern part of South America, such as Argentina, Chile and Uruguay, have considerably lower levels of homicide than countries further north, such as Brazil, Colombia and the Bolivarian Republic of Venezuela. Eastern Europe and SouthEastern Asia are other examples of sub-regions that show large disparities at the national level (see figure 1.5). For example, in the former, though
22
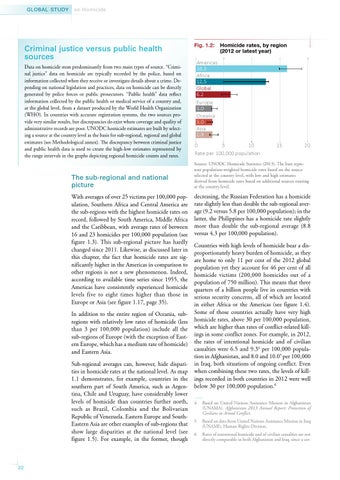
Fig. 1.2: Homicide rates, by region (2012 or latest year)
Americas 16.3 Africa 12.5 Global 6.2 Europe 3.0 Oceania 3.0 Asia 2.9 0 5 10 Rate per 100,000 population
15
20
Source: UNODC Homicide Statistics (2013). The bars represent population-weighted homicide rates based on the source selected at the country level, with low and high estimates derived from homicide rates based on additional sources existing at the country level.
decreasing, the Russian Federation has a homicide rate slightly less than double the sub-regional average (9.2 versus 5.8 per 100,000 population); in the latter, the Philippines has a homicide rate slightly more than double the sub-regional average (8.8 versus 4.3 per 100,000 population). Countries with high levels of homicide bear a disproportionately heavy burden of homicide, as they are home to only 11 per cent of the 2012 global population yet they account for 46 per cent of all homicide victims (200,000 homicides out of a population of 750 million). This means that three quarters of a billion people live in countries with serious security concerns, all of which are located in either Africa or the Americas (see figure 1.4). Some of those countries actually have very high homicide rates, above 30 per 100,000 population, which are higher than rates of conflict-related killings in some conflict zones. For example, in 2012, the rates of intentional homicide and of civilian casualties were 6.5 and 9.34 per 100,000 population in Afghanistan, and 8.0 and 10.05 per 100,000 in Iraq, both situations of ongoing conflict. Even when combining these two rates, the levels of killings recorded in both countries in 2012 were well below 30 per 100,000 population.6 4 Based on United Nations Assistance Mission in Afghanistan (UNAMA). Afghanistan 2013 Annual Report: Protection of Civilians in Armed Conflict. 5
Based on data from United Nations Assistance Mission in Iraq (UNAMI), Human Rights Division.
6
Rates of intentional homicide and of civilian casualties are not directly comparable in both Afghanistan and Iraq, since a cer-