International Migration Policies: Government Views and Priorities
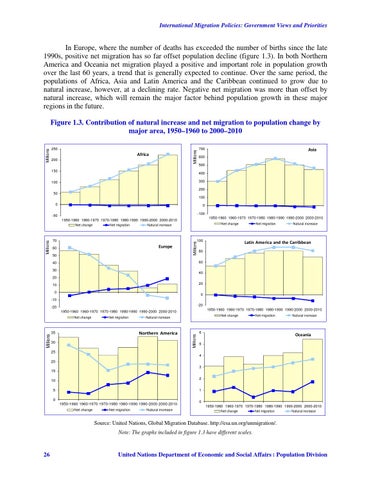
In Europe, where the number of deaths has exceeded the number of births since the late 1990s, positive net migration has so far offset population decline (figure 1.3). In both Northern America and Oceania net migration played a positive and important role in population growth over the last 60 years, a trend that is generally expected to continue. Over the same period, the populations of Africa, Asia and Latin America and the Caribbean continued to grow due to natural increase, however, at a declining rate. Negative net migration was more than offset by natural increase, which will remain the major factor behind population growth in these major regions in the future.
250
Millions
Millions
Figure 1.3. Contribution of natural increase and net migration to population change by major area, 1950–1960 to 2000–2010 Africa 200 150
700
Asia
600 500 400 300
100
200 50 100 0
0 -100
-50
1950-1960 1960-1970 1970-1980 1980-1990 1990-2000 2000-2010
1950-1960 1960-1970 1970-1980 1980-1990 1990-2000 2000-2010 Net migration
Net change
Natural increase
100
70
Europe
60 50
Millions
Millions
Net change
Net migration
Natural increase
Latin America and the Carribbean
80 60
40 30
40
20 20
10 0
0
-10 -20
-20
1950-1960 1960-1970 1970-1980 1980-1990 1990-2000 2000-2010
1950-1960 1960-1970 1970-1980 1980-1990 1990-2000 2000-2010 Net migration
Northern America
35
Net change
Natural increase
30
Millions
Millions
Net change
Net migration
6
Natural increase
Oceania
5
25
4 20
3 15
2
10
1
5 0 1950-1960 1960-1970 1970-1980 1980-1990 1990-2000 2000-2010 Net change
Net migration
Natural increase
0 1950-1960 1960-1970 1970-1980 1980-1990 1990-2000 2000-2010 Net change
Net migration
Natural increase
Source: United Nations, Global Migration Database. http://esa.un.org/unmigration/. Note: The graphs included in figure 1.3 have different scales.
26
United Nations Department of Economic and Social Affairs ׀Population Division