International Migration Policies: Government Views and Priorities
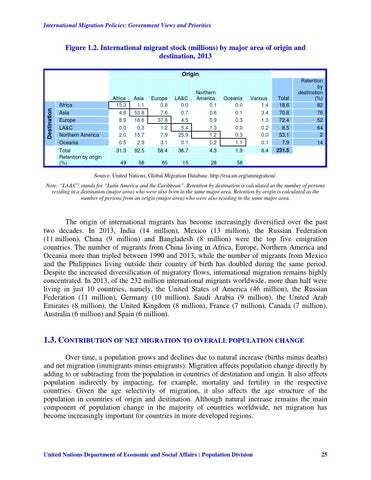
Figure 1.2. International migrant stock (millions) by major area of origin and destination, 2013 Origin
Africa 15.3
Asia 1.1
Europe 0.8
LA&C 0.0
Northern America 0.1
Oceania 0.0
Various 1.4
Total 18.6
Retention by destination (%) 82
Asia Europe
4.6 8.9
53.8 18.6
7.6 37.8
0.7 4.5
0.6 0.9
0.1 0.3
3.4 1.3
70.8 72.4
76 52
LA&C Northern America
0.0 2.0
0.3 15.7
1.2 7.9
5.4 25.9
1.3 1.2
0.0 0.3
0.2 0.0
8.5 53.1
64 2 14
Destination
Africa
Oceania Total Retention by origin (%)
0.5
2.9
3.1
0.1
0.2
1.1
0.1
7.9
31.3
92.5
58.4
36.7
4.3
1.9
6.4
231.5
49
58
65
15
28
58
Source: United Nations, Global Migration Database. http://esa.un.org/unmigration/. Note: “LA&C” stands for “Latin America and the Caribbean”. Retention by destination is calculated as the number of persons residing in a destination (major area) who were also born in the same major area. Retention by origin is calculated as the number of persons from an origin (major area) who were also residing in the same major area.
The origin of international migrants has become increasingly diversified over the past two decades. In 2013, India (14 million), Mexico (13 million), the Russian Federation (11 million), China (9 million) and Bangladesh (8 million) were the top five emigration countries. The number of migrants from China living in Africa, Europe, Northern America and Oceania more than tripled between 1990 and 2013, while the number of migrants from Mexico and the Philippines living outside their country of birth has doubled during the same period. Despite the increased diversification of migratory flows, international migration remains highly concentrated. In 2013, of the 232 million international migrants worldwide, more than half were living in just 10 countries, namely, the United States of America (46 million), the Russian Federation (11 million), Germany (10 million), Saudi Arabia (9 million), the United Arab Emirates (8 million), the United Kingdom (8 million), France (7 million), Canada (7 million), Australia (6 million) and Spain (6 million).
1.3. CONTRIBUTION OF NET MIGRATION TO OVERALL POPULATION CHANGE Over time, a population grows and declines due to natural increase (births minus deaths) and net migration (immigrants minus emigrants). Migration affects population change directly by adding to or subtracting from the population in countries of destination and origin. It also affects population indirectly by impacting, for example, mortality and fertility in the respective countries. Given the age selectivity of migration, it also affects the age structure of the population in countries of origin and destination. Although natural increase remains the main component of population change in the majority of countries worldwide, net migration has become increasingly important for countries in more developed regions.
United Nations Department of Economic and Social Affairs ׀Population Division
25