India India’s INDC for the period 2021 to 2030 included the following intentions: “[…] to put forward and further propagate a healthy and sustainable way of living based on traditions and values of conservation and moderation; to adopt a climate friendly and a cleaner path than the one followed hitherto by others at corresponding level of economic development; to reduce the emissions intensity of its GDP by 33 to 35 per cent by 2030 from 2005 level; to achieve about 40 per cent cumulative electric power installed capacity from non-fossil fuel based energy resources by 2030 with the help of transfer of technology and low cost international finance including from Green Climate Fund (GCF); to create an additional carbon sink of 2.5 to 3 billion tonnes of CO2 equivalent through additional forest and tree cover by 2030” (UNFCCC, 2015). The sectors and gases covered by the intensity target are not specified. The studies assessed show a wide range of potential mitigation impacts of India’s INDC on national emissions,
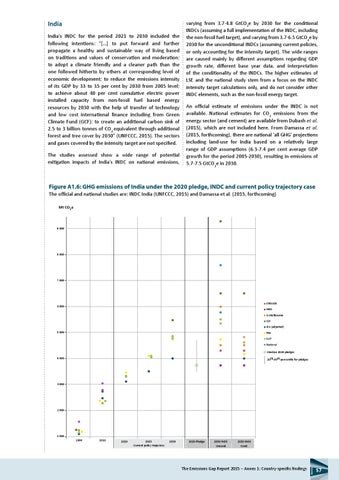
varying from 3.7-4.8 GtCO2e by 2030 for the conditional INDCs (assuming a full implementation of the INDC, including the non-fossil fuel target), and varying from 3.7-6.5 GtCO2e by 2030 for the unconditional INDCs (assuming current policies, or only accounting for the intensity target). The wide ranges are caused mainly by different assumptions regarding GDP growth rate, different base year data, and interpretation of the conditionality of the INDCs. The higher estimates of LSE and the national study stem from a focus on the INDC intensity target calculations only, and do not consider other INDC elements, such as the non-fossil energy target. An official estimate of emissions under the INDC is not available. National estimates for CO2 emissions from the energy sector (and cement) are available from Dubash et al. (2015), which are not included here. From Damassa et al. (2015, forthcoming), there are national ‘all GHG’ projections including land-use for India based on a relatively large range of GDP assumptions (6.3-7.4 per cent average GDP growth for the period 2005-2030), resulting in emissions of 5.7-7.5 GtCO2e in 2030.
Figure A1.6: GHG emissions of India under the 2020 pledge, INDC and current policy trajectory case The official and national studies are: INDC India India (UNFCCC, 2015) and Damassa et al. (2015, forthcoming) Mt CO2e
9 000
8 000
7 000
CROADS
6 000
NIES U.Melbourne LSE IEA (adjusted)
5 000
PBL CAT
Median 2020 pledges 4 000
10th-90th percentile for pledges
3 000
2 000
1 000 1990
2010
2020
2025 Current policy trajectory
2030
2020 2020PLEDGE Pledge
2030 INDC Uncond.
2030 INDC Cond.
The Emissions Gap Report 2015 – Annex 1: Country-specific findings
57