China
emissions other than CO2 emissions from the energy sector (and cement), etc. The higher estimates of LSE, CROADS and Climate Advisers are confined to the INDC intensity target calculations only.
China’s INDC includes an intention to peak CO2 emissions around 2030, making best efforts to peak earlier, to reduce the carbon intensity of GDP by 60-65 per cent from 2005 levels by 2030, to increase the share of non-fossil fuels in primary energy consumption to around 20 per cent by 2030, and to increase the forest stock volume by around 4.5 billion cubic metres from 2005 levels by 2030. Although China’s INDC is framed in terms of CO2, the discussion text also implies action on other gases. China’s INDC also includes a comprehensive list of actions. The GHG targets cover CO2, but the sectors to which the targets apply are not specified.
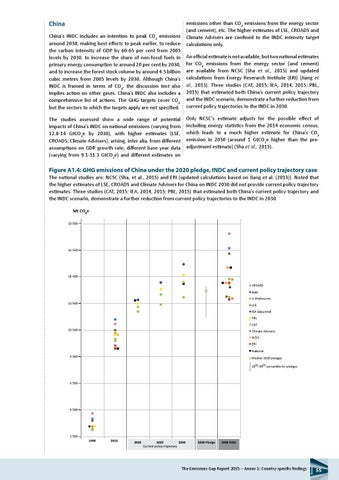
An official estimate is not available, but two national estimates for CO2 emissions from the energy sector (and cement) are available from NCSC (Sha et al., 2015) and updated calculations from Energy Reserarch Institute (ERI) (Jiang et al., 2013). Three studies (CAT, 2015; IEA, 2014, 2015; PBL, 2015) that estimated both China’s current policy trajectory and the INDC scenario, demonstrate a further reduction from current policy trajectories to the INDC in 2030. Only NCSC’s estimate adjusts for the possible effect of including energy statistics from the 2014 economic census, which leads to a much higher estimate for China’s CO2 emission in 2030 (around 1 GtCO2e higher than the preadjustment estimate) (Sha et al., 2015).
The studies assessed show a wide range of potential impacts of China’s INDC on national emissions (varying from 12.8-14 GtCO2e by 2030), with higher estimates (LSE, CROADS, Climate Advisers), arising, inter alia, from different assumptions on GDP growth rate, different base year data (varying from 9.1-11.3 GtCO2e) and different estimates on
Figure A1.4: GHG emissions of China under the 2020 pledge, INDC and current policy trajectory case The national studies are: NCSC (Sha, et al., 2015) and ERI (updated calculations based on Jiang et al. (2013)). Noted that the higher estimates of LSE, CROADS and Climate Advisers for China on INDC 2030 did not provide current policy trajectory estimates. Three studies (CAT, 2015; IEA, 2014, 2015; PBL, 2015) that estimated both China’s current policy trajectory and China from current policy trajectories to the INDC in 2030. the INDC scenario, demonstrate a further reduction Mt CO2e 18 500
16 500
14 500 CROADS NIES U.Melbourne 12 500
LSE IEA (adjusted) PBL CAT
10 500
Climate Advisors NCSC ERI National
8 500
Median 2020 pledges 10th-90th percentile for pledges
6 500
4 500
2 500 1990
2010
2020
2025 2030 Current policy trajectory
2020 Pledge
2030 INDC
The Emissions Gap Report 2015 – Annex 1: Country-specific findings
55