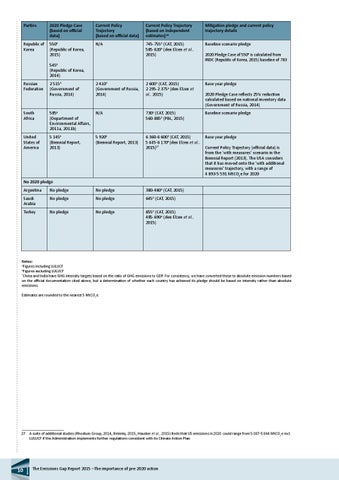
Parties
2020 Pledge Case (based on official data)
Current Policy Trajectory (based on official data)
Current Policy Trajectory (based on independent estimates) 24
Mitigation pledge and current policy trajectory details
Republic of Korea
550a (Republic of Korea, 2015)
N/A
745-755b (CAT, 2015) 585-620b (den Elzen et al., 2015)
Baseline scenario pledge
545a (Republic of Korea, 2014)
2020 Pledge Case of 550a is calculated from INDC (Republic of Korea, 2015) baseline of 783
Russian Federation
2 515b (Government of Russia, 2014)
2 410b (Government of Russia, 2014)
2 600b (CAT, 2015) 2 295-2 375b (den Elzen et al., 2015)
Base year pledge
South Africa
585a (Department of Environmental Affairs, 2011a, 2011b)
N/A
730b (CAT, 2015) 560-885b (PBL, 2015)
Baseline scenario pledge
United States of America
5 145a (Biennial Report, 2013)
5 920a (Biennial Report, 2013)
6 360-6 600b (CAT, 2015) 5 445-6 170a (den Elzen et al., 2015)27
Base year pledge
2020 Pledge Case reflects 25% reduction calculated based on national inventory data (Government of Russia, 2014)
Current Policy Trajectory (official data) is from the ‘with measures’ scenario in the Biennial Report (2013). The USA considers that it has moved onto the ‘with additional measures’ trajectory, with a range of 4 893-5 591 MtCO2e for 2020
No 2020 pledge Argentina
No pledge
No pledge
380-480b (CAT, 2015)
Saudi Arabia
No pledge
No pledge
645b (CAT, 2015)
Turkey
No pledge
No pledge
655b (CAT, 2015) 485-690b (den Elzen et al., 2015)
Notes: a Figures including LULUCF b Figures excluding LULUCF * China and India have GHG intensity targets based on the ratio of GHG emissions to GDP. For consistency, we have converted these to absolute emission numbers based on the official documentation cited above, but a determination of whether each country has achieved its pledge should be based on intensity rather than absolute emissions. Estimates are rounded to the nearest 5 MtCO2e.
27 A suite of additional studies (Rhodium Group, 2014; Belenky, 2015; Hausker et al., 2015) finds that US emissions in 2020 could range from 5 087-5 844 MtCO2e incl. LULUCF if the Administration implements further regulations consistent with its Climate Action Plan.
10
The Emissions Gap Report 2015 –The importance of pre-2020 action