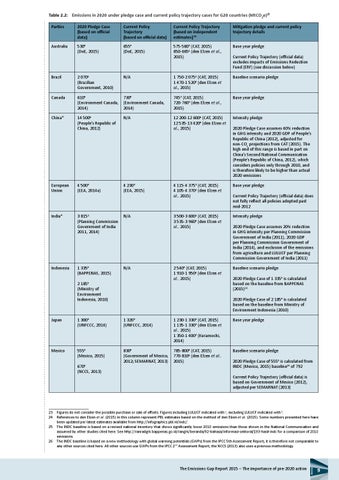
Table 2.2: 22Emissions in 2020 under pledge case and current policy trajectory cases for G20 countries (MtCO2e)2324252627 Parties
2020 Pledge Case (based on official data)
Current Policy Trajectory (based on official data)
Current Policy Trajectory (based on independent estimates) 24
Mitigation pledge and current policy trajectory details
Australia
530a (DoE, 2015)
655a (DoE, 2015)
575-580b (CAT, 2015) 650-665a (den Elzen et al., 2015)
Base year pledge
Brazil
2 070a (Brazilian Government, 2010)
N/A
1 750-2 075a (CAT, 2015) 1 470-1 520a (den Elzen et al., 2015)
Baseline scenario pledge
Canada
610a (Environment Canada, 2014)
730a (Environment Canada, 2014)
745b (CAT, 2015) 720-760b (den Elzen et al., 2015)
Base year pledge
China*
14 500a (People’s Republic of China, 2012)
N/A
12 200-12 600a (CAT, 2015) 12 535-13 420a (den Elzen et al., 2015)
Intensity pledge
European Union
4 500b (EEA, 2014a)
4 230b (EEA, 2015)
4 115-4 375b (CAT, 2015) 4 105-4 370b (den Elzen et al., 2015)
Base year pledge
India*
3 815b (Planning Commission Government of India 2011, 2014)
N/A
3 500-3 600b (CAT, 2015) 3 535-3 960a (den Elzen et al., 2015)
Intensity pledge
1 335a (BAPPENAS, 2015)
N/A
2 540a (CAT, 2015) 1 910-1 950a (den Elzen et al., 2015)
Baseline scenario pledge
Indonesia
2 185a (Ministry of Environment Indonesia, 2010)
Current Policy Trajectory (official data) excludes impacts of Emissions Reduction Fund (ERF) (see discussion below)
2020 Pledge Case assumes 40% reduction in GHG intensity and 2020 GDP of People’s Republic of China (2012), adjusted for non-CO2 projections from CAT (2015). The high end of this range is based in part on China’s Second National Communication (People’s Republic of China, 2012), which considers policies only through 2010, and is therefore likely to be higher than actual 2020 emissions
Current Policy Trajectory (official data) does not fully reflect all policies adopted past mid-2012
2020 Pledge Case assumes 20% reduction in GHG intensity per Planning Commission Government of India (2011), 2020 GDP per Planning Commission Government of India (2014), and exclusion of the emissions from agriculture and LULUCF per Planning Commission Government of India (2011)
2020 Pledge Case of 1 335a is calculated based on the baseline from BAPPENAS (2015)25 2020 Pledge Case of 2 185a is calculated based on the baseline from Ministry of Environment Indonesia (2010)
Japan
1 300b (UNFCCC, 2014)
1 320b (UNFCCC, 2014)
1 230-1 330b (CAT, 2015) 1 135-1 330b (den Elzen et al., 2015) 1 350-1 400b (Kuramochi, 2014)
Base year pledge
Mexico
555a (Mexico, 2015)
830a (Government of Mexico, 2012; SEMARNAT, 2013)
785-800a (CAT, 2015) 770-810a (den Elzen et al., 2015)
Baseline scenario pledge
670a (NCCS, 2013)
2020 Pledge Case of 555a is calculated from INDC (Mexico, 2015) baseline26 of 792 Current Policy Trajectory (official data) is based on Government of Mexico (2012), adjusted per SEMARNAT (2013)
22
23 Figures do not consider the possible purchase or sale of offsets. Figures including LULUCF indicated with a, excluding LULUCF indicated with b. 24 References to den Elzen et al. (2015) in this column represent PBL estimates based on the method of den Elzen et al. (2015). Some numbers presented here have been updated per latest estimates available from http://infographics.pbl.nl/indc/. 25 The INDC baseline is based on a revised national inventory that shows significantly lower 2010 emissions than those shown in the National Communication and assumed by other studies cited here. See http://ranradgrk.bappenas.go.id/rangrk/beranda/92-bahasa/informasi-sektoral/193-hasil-indc for a comparison of 2010 emissions. 26 The INDC baseline is based on a new methodology with global warming potentials (GWPs) from the IPCC 5th Assessment Report; it is therefore not comparable to any other sources cited here. All other sources use GWPs from the IPCC 2nd Assessment Report; the NCCS (2013) also uses a previous methodology. 27
The Emissions Gap Report 2015 – The importance of pre-2020 action
9