Box 2.1: The global carbon dioxide (CO2) budget, non-CO2 GHGs and the link to global warming
Limiting warming to any desired level requires a cap on total, cumulative anthropogenic CO2 emissions. Working Group I of the IPCC (IPCC, 2013) showed that global mean temperature increases are almost directly proportional to cumulative carbon dioxide emissions since the pre-industrial period. This leads to the important conclusion that there is a maximum amount of carbon dioxide emissions, or a CO2 budget, that can be discharged to the atmosphere over time if society wishes to stay within a 2°C or other global warming limit. The IPCC indicated that to limit warming to below 2°C with a ‘likely chance’ (that is >66% chance) by the end of the century, about 1 000 GtCO2 of CO2 emissions remained ‘in the budget’ from 2011 onward* (IPCC, 2014b; Knutti and Rogelj, 2015). To keep CO2 emissions within such a budget allowance, annual global CO2 emissions have to become zero at some point during the 21st century. This is a geophysical requirement that applies regardless of the budget level chosen. For non-CO2 GHGs with a shorter lifetime in the atmosphere, such as methane, the levels of emissions that are emitted per year are more important than the cumulative amount**. Reducing their annual emissions is also important to limit global mean temperature increase to low levels. Table 2.1 indicates the year of global annual emissions becoming net zero for each of the pathways considered. * This number is accompanied by an uncertainty range, which depends on the concurrent mitigation of non-CO2 GHGs. ** This is approximately true, as for non-CO2 GHGs that stay in the atmosphere for quite a while (for example, N2O has an atmospheric lifetime of 121 years) there is also a more limited cumulative effect. See, for example, Smith et al. (2012).
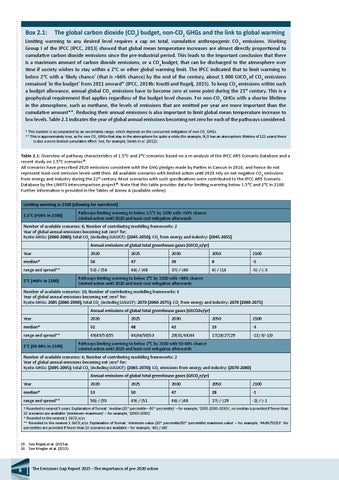
Table 2.1: Overview of pathway characteristics of 1.5°C and 2°C scenarios based on a re-analysis of the IPCC AR5 Scenario Database and a recent study on 1.5°C scenarios15. All scenarios have prescribed 2020 emissions consistent with the GHG pledges made by Parties in Cancun in 2010, and hence do not represent least-cost emission levels until then. All available scenarios with limited action until 2020 rely on net negative CO2 emissions from energy and industry during the 21st century. Most scenarios with such specifications were contributed to the IPCC AR5 Scenario Database by the LIMITS intercomparison project16. Note that this table provides data for limiting warming below 1.5°C and 2°C in 2100. Further information is provided in the Tables of Annex A (available online) Limiting warming in 2100 (allowing for overshoot) 1.5°C (>50% in 2100)
Pathways limiting warming to below 1.5°C by 2100 with >50% chance Limited action until 2020 and least-cost mitigation afterwards
Number of available scenarios: 6; Number of contributing modelling frameworks: 2 Year of global annual emissions becoming net zero† for: Kyoto-GHGs: (2060-2080); total CO2 (including LULUCF): (2045-2050); CO2 from energy and industry: (2045-2055) Annual emissions of global total greenhouse gases [GtCO2e/yr] Year
2020
2025
2030
2050
2100
median*
56
47
39
8
-5
53(-/-)56
46(-/-)48
37(-/-)40
4(-/-)14
-5(-/-)-3
range and spread** 2°C (>66% in 2100)
Pathways limiting warming to below 2°C by 2100 with >66% chance Limited action until 2020 and least-cost mitigation afterwards
Number of available scenarios: 10; Number of contributing modelling frameworks: 4 Year of global annual emissions becoming net zero† for: Kyoto-GHGs: 2085 (2080-2090); total CO2 (including LULUCF): 2070 (2060-2075); CO2 from energy and industry: 2070 (2060-2075) Annual emissions of global total greenhouse gases [GtCO2e/yr] Year
2020
2025
2030
2050
2100
median*
52
48
42
23
-3
range and spread**
49(49/53)55
44(46/50)53
29(31/44)44
17(18/27)29
-11(-9/-1)0
2°C (50-66% in 2100)
Pathways limiting warming to below 2°C by 2100 with 50-66% chance Limited action until 2020 and least-cost mitigation afterwards
Number of available scenarios: 4; Number of contributing modelling frameworks: 2 Year of global annual emissions becoming net zero† for: Kyoto-GHGs: (2095-2095); total CO2 (including LULUCF): (2065-2070); CO2 emissions from energy and industry: (2070-2080) Annual emissions of global total greenhouse gases [GtCO2e/yr] Year
2020
2025
2030
2050
2100
median*
53
50
47
28
-1
range and spread**
50(-/-)55
49(-/-)51
46(-/-)48
27(-/-)29
-2(-/-)-1
† Rounded to nearest 5 years. Explanation of format: ‘median (20th percentile – 80th percentile)’ – for example, ‘2085 (2080-2090)’; no median is provided if fewer than 10 scenarios are available ‘(minimum–maximum)’ – for example, ‘(2060-2080)’. * Rounded to the nearest 1 GtCO2e/yr . ** Rounded to the nearest 1 GtCO2e/yr. Explanation of format: ‘minimum value (20th percentile/80th percentile) maximum value’ – for example, ‘44(46/50)53’. No percentiles are provided if fewer than 10 scenarios are available – for example, ‘46(-/-)48’.
15 See Rogelj et al. (2015a). 16 See Kriegler et al. (2013).
6
The Emissions Gap Report 2015 –The importance of pre-2020 action