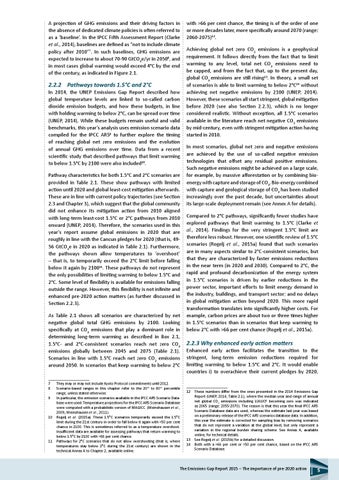
A projection of GHG emissions and their driving factors in the absence of dedicated climate policies is often referred to as a ‘baseline’. In the IPCC Fifth Assessment Report (Clarke et al., 2014), baselines are defined as “not to include climate policy after 2010”7. In such baselines, GHG emissions are expected to increase to about 70-90 GtCO2e/yr in 20508, and in most cases global warming would exceed 4°C by the end of the century, as indicated in Figure 2.1.
2.2.2 Pathways towards 1.5°C and 2°C
In 2014, the UNEP Emissions Gap Report described how global temperature levels are linked to so-called carbon dioxide emission budgets, and how these budgets, in line with holding warming to below 2°C, can be spread over time (UNEP, 2014). While these budgets remain useful and valid benchmarks, this year’s analysis uses emission scenario data compiled for the IPCC AR59 to further explore the timing of reaching global net zero emissions and the evolution of annual GHG emissions over time. Data from a recent scientific study that described pathways that limit warming to below 1.5°C by 2100 were also included10. Pathway characteristics for both 1.5°C and 2°C scenarios are provided in Table 2.1. These show pathways with limited action until 2020 and global least-cost mitigation afterwards. These are in line with current policy trajectories (see Section 2.3 and Chapter 3), which suggest that the global community did not enhance its mitigation action from 2010 aligned with long-term least-cost 1.5°C or 2°C pathways from 2010 onward (UNEP, 2014). Therefore, the scenarios used in this year’s report assume global emissions in 2020 that are roughly in line with the Cancun pledges for 2020 (that is, 4956 GtCO2e in 2020 as indicated in Table 2.1). Furthermore, the pathways shown allow temperatures to ‘overshoot’ – that is, to temporarily exceed the 2°C limit before falling below it again by 210011. These pathways do not represent the only possibilities of limiting warming to below 1.5°C and 2°C. Some level of flexibility is available for emissions falling outside the range. However, this flexibility is not infinite and enhanced pre-2020 action matters (as further discussed in section 2.2.3). As Table 2.1 shows all scenarios are characterized by net negative global total GHG emissions by 2100. Looking specifically at CO2 emissions that play a dominant role in determining long-term warming as described in Box 2.1, 1.5°C- and 2°C-consistent scenarios reach net zero CO2 emissions globally between 2045 and 2075 (Table 2.1). Scenarios in line with 1.5°C reach net zero CO2 emissions around 2050. In scenarios that keep warming to below 2°C 7 8
They may or may not include Kyoto Protocol commitments until 2012. Scenario-based ranges in this chapter refer to the 20th to 80th percentile range, unless stated otherwise. 9 In particular, the emission scenarios available in the IPCC AR5 Scenario Database were used. Temperature projections for the IPCC AR5 Scenario Database were computed with a probabilistic version of MAGICC. (Meinshausen et al., 2009; Meinshausen et al., 2011). 10 Rogelj et al. (2015a). These 1.5°C scenarios temporarily exceed the 1.5°C limit during the 21st century in order to fall below it again with >50 per cent chance in 2100. This is sometimes referred to as a temperature overshoot. Insufficient data are available for assessing pathways that return warming to below 1.5°C by 2100 with >66 per cent chance. 11 Pathways for 2°C scenarios that do not allow overshooting (that is, where temperatures stay below 2°C during the 21st century) are shown in the technical Annex A to Chapter 2, available online.
with >66 per cent chance, the timing is of the order of one or more decades later, more specifically around 2070 (range: 2060-2075)12. Achieving global net zero CO2 emissions is a geophysical requirement. It follows directly from the fact that to limit warming to any level, total net CO2 emissions need to be capped, and from the fact that, up to the present day, global CO2 emissions are still rising13. In theory, a small set of scenarios is able to limit warming to below 2°C14 without achieving net negative emissions by 2100 (UNEP, 2014). However, these scenarios all start stringent, global mitigation before 2020 (see also Section 2.2.3), which is no longer considered realistic. Without exception, all 1.5°C scenarios available in the literature reach net negative CO2 emissions by mid-century, even with stringent mitigation action having started in 2010. In most scenarios, global net zero and negative emissions are achieved by the use of so-called negative emission technologies that offset any residual positive emissions. Such negative emissions might be achieved on a large scale, for example, by massive afforestation or by combining bioenergy with capture and storage of CO2. Bio-energy combined with capture and geological storage of CO2 has been studied increasingly over the past decade, but uncertainties about its large-scale deployment remain (see Annex A for details). Compared to 2°C pathways, significantly fewer studies have explored pathways that limit warming to 1.5°C (Clarke et al., 2014). Findings for the very stringent 1.5°C limit are therefore less robust. However, one scientific review of 1.5°C scenarios (Rogelj et al., 2015a) found that such scenarios are in many aspects similar to 2°C-consistent scenarios, but that they are characterized by faster emissions reductions in the near term (in 2020 and 2030). Compared to 2°C, the rapid and profound decarbonization of the energy system in 1.5°C scenarios is driven by earlier reductions in the power sector, important efforts to limit energy demand in the industry, buildings, and transport sector; and no delays in global mitigation action beyond 2020. This more rapid transformation translates into significantly higher costs. For example, carbon prices are about two or three times higher in 1.5°C scenarios than in scenarios that keep warming to below 2°C with >66 per cent chance (Rogelj et al., 2015a).
2.2.3 Why enhanced early action matters
Enhanced early action facilitates the transition to the stringent, long-term emission reductions required for limiting warming to below 1.5°C and 2°C. It would enable countries i) to overachieve their current pledges by 2020,
12 These numbers differ from the ones presented in the 2014 Emissions Gap Report (UNEP, 2014, Table 2.1), where the median year and range of annual net global CO2 emissions including LULUCF becoming zero was indicated as 2065 (range: 2055-2070). The reason is that this year the final IPCC AR5 Scenario Database data are used, whereas the estimate last year was based on a preliminary release of the IPCC AR5 scenarios database data. In addition, this year the estimate is corrected for sampling bias by removing scenarios that do not represent a variation at the global level, but only represent a variation in the regional burden sharing scheme. See Annex A, available online, for technical details. 13 See Rogelj et al. (2015b) for a detailed discussion. 14 Both with a >66 per cent or >50 per cent chance, based on the IPCC AR5 Scenario Database.
The Emissions Gap Report 2015 – The importance of pre-2020 action
5