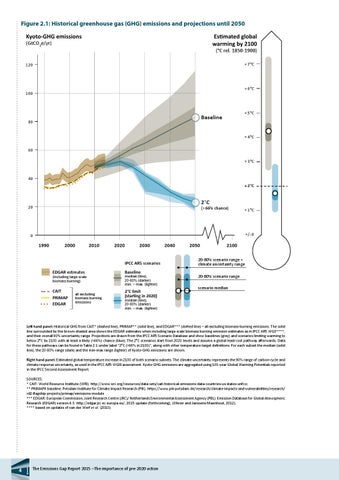
Figure 2.1: Historical greenhouse gas (GHG) emissions and projections until 2050.
Figure 2.1: Historical greenhouse gas (GHG) emissions and projections until 2050 Kyoto-GHG emissions
Estimated global warming by 2100
(GtCO2e/yr)
(°C rel. 1850-1900) + 7°C
120
+ 6°C
100
+ 5°C
Baseline
80
+ 4°C 60 + 3°C
40 + 2°C
2°C
20
(> 66% chance)
+ 1°C
+/- 0
0
1990
2000
2010
2020
2030 IPCC AR5 scenarios
EDGAR estimates
Baseline
CAIT PRIMAP EDGAR
2°C limit (starting in 2020)
(including large-scale biomass burning) all excluding biomass burning emissions
median (line), 20-80% (darker) min. – max. (lighter)
2040
2050
2100
20-80% scenario range + climate uncertainty range 20-80% scenario range scenario median
median (line), 20-80% (darker) min. – max. (lighter)
Left hand panel: Historical GHG from CAIT* (dashed line), PRIMAP** (solid line), and EDGAR*** (dotted line) – all excluding biomass-burning emissions. The solid line surrounded by the brown-shaded area shows the EDGAR estimates when including large-scale biomass burning emission estimates as in IPCC AR5 WG3****, and their overall 90% uncertainty range. Projections are drawn from the IPCC AR5 Scenario Database and show baselines (grey) and scenarios limiting warming to below 2°C by 2100 with at least a likely (>66%) chance (blue). The 2°C scenarios start from 2020 levels and assume a global least-cost pathway afterwards. Data for these pathways can be found in Table 2.1 under label “2°C (>66% in 2100)”, along with other temperature target definitions. For each subset the median (solid line), the 20-80% range (dark) and the min-max range (lighter) of Kyoto-GHG emissions are shown. Right hand panel: Estimated global temperature increase in 2100 of both scenario subsets. The climate uncertainty represents the 90% range of carbon-cycle and climate response uncertainty, as used in the IPCC AR5 WGIII assessment. Kyoto-GHG emissions are aggregated using 100-year Global Warming Potentials reported in the IPCC Second Assessment Report. SOURCES: * CAIT: World Resource Institute (WRI). http://www.wri.org/resources/data-sets/cait-historical-emissions-data-countries-us-states-unfccc ** PRIMAP4 baseline: Potsdam Institute for Climate Impact Research (PIK). https://www.pik-potsdam.de/research/climate-impacts-and-vulnerabilities/research/ rd2-flagship-projects/primap/emissions-module *** EDGAR: European Commission, Joint Research Centre (JRC)/ Netherlands Environmental Assessment Agency (PBL). Emission Database for Global Atmospheric Research (EDGAR) version 4.3. http://edgar.jrc.ec.europa.eu/, 2015 update (forthcoming), (Olivier and Janssens-Maenhout, 2012). **** based on updates of van der Werf et al. (2010).
4
The Emissions Gap Report 2015 –The importance of pre-2020 action