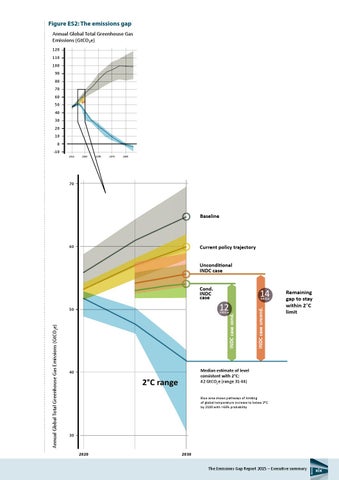
Figure ES2: The emissions gap Annual Global Total Greenhouse Gas Emissions (GtCO2e) 120 110 100 90 80 70 60 50 40 30 20 10 0 -10 2010
2030
2050
2070
2090
70
Baseline
60
Current policy trajectory Unconditional INDC case
GtCO2e
12 GtCO2e
INDC case cond.
Annual Global Total Greenhouse Gas Emissions (GtCO2e)
50
14 INDC case uncond.
Cond. INDC case
Remaining gap to stay within 2°C limit
Median estimate of level consistent with 2°C: 42 GtCO2e (range 31-44)
40
2°C range
Blue area shows pathways of limiting of global temperature increase to below 2°C by 2100 with >66% probability
30
2020
2030 The Emissions Gap Report 2015 – Executive summary
xix