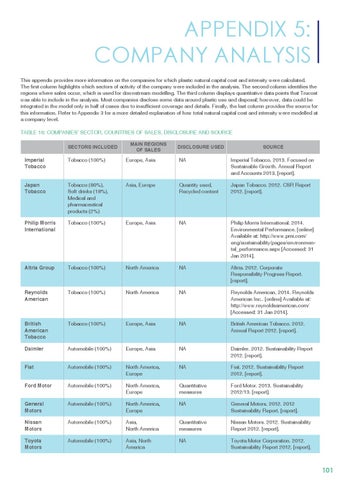
APPENDIX 5: company analysis This appendix provides more information on the companies for which plastic natural capital cost and intensity were calculated. The first column highlights which sectors of activity of the company were included in the analysis. The second column identifies the regions where sales occur, which is used for downstream modelling. The third column displays quantitative data points that Trucost was able to include in the analysis. Most companies disclose some data around plastic use and disposal; however, data could be integrated in the model only in half of cases due to insufficient coverage and details. Finally, the last column provides the source for this information. Refer to Appendix 3 for a more detailed explanation of how total natural capital cost and intensity were modelled at a company level. TABLE 16: COMPANIES’ SECTOR, COUNTRIES OF SALES, DISCLOSURE AND SOURCE Sectors included
main Regions of sales
Disclosure used
Source
Imperial Tobacco
Tobacco (100%)
Europe, Asia
NA
Imperial Tobacco. 2013. Focused on Sustainable Growth. Annual Report and Accounts 2013. [report].
Japan Tobacco
Tobacco (80%), Soft drinks (18%), Medical and pharmaceutical products (2%)
Asia, Europe
Quantity used, Recycled content
Japan Tobacco. 2012. CSR Report 2012. [report].
Philip Morris International
Tobacco (100%)
Europe, Asia
NA
Philip Morris International. 2014. Environmental Performance. [online] Available at: http://www.pmi.com/ eng/sustainability/pages/environmental_performance.aspx [Accessed: 31 Jan 2014].
Altria Group
Tobacco (100%)
North America
NA
Altria. 2012. Corporate Responsibility Progress Report. [report].
Reynolds American
Tobacco (100%)
North America
NA
Reynolds American. 2014. Reynolds American Inc.. [online] Available at: http://www.reynoldsamerican.com/ [Accessed: 31 Jan 2014].
British American Tobacco
Tobacco (100%)
Europe, Asia
NA
British American Tobacco. 2012. Annual Report 2012. [report].
Daimler
Automobile (100%)
Europe, Asia
NA
Daimler. 2012. Sustainability Report 2012. [report].
Fiat
Automobile (100%)
North America, Europe
NA
Fiat. 2012. Sustainability Report 2012. [report].
Ford Motor
Automobile (100%)
North America, Europe
Quantitative measures
Ford Motor. 2013. Sustainability 2012/13. [report].
General Motors
Automobile (100%)
North America, Europe
NA
General Motors. 2012. 2012 Sustainability Report. [report].
Nissan Motors
Automobile (100%)
Asia, North America
Quantitative measures
Nissan Motors. 2012. Sustainability Report 2012. [report].
Toyota Motors
Automobile (100%)
Asia, North America
NA
Toyota Motor Corporation. 2012. Sustainability Report 2012. [report].
101