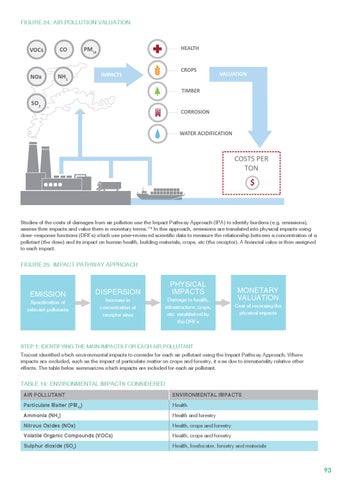
FIGURE 24: AIR POLLUTION VALUATION
VOCs
CO
NOx
NH3
HEALTH
PM10
CROPS
IMPACTS
VALUATION
TIMBER
SO2
CORROSION
WATER ACIDIFICATION
COSTS PER TON
$
Studies of the costs of damages from air pollution use the Impact Pathway Approach (IPA) to identify burdens (e.g. emissions), assess their impacts and value them in monetary terms.178 In this approach, emissions are translated into physical impacts using dose–response functions (DRFs) which use peer-reviewed scientific data to measure the relationship between a concentration of a pollutant (the dose) and its impact on human health, building materials, crops, etc (the receptor). A financial value is then assigned to each impact.
FIGURE 25: IMPACT PATHWAY APPROACH
EMISSION Specification of relevant pollutants
PHYSICAL IMPACTS
DISPERSION Increase in concentration at receptor sites
Damage to health, infrastructure, crops, etc. established by the DRFs
MONETARY VALUATION Cost of reversing the physical impacts
STEP 1: IDENTIFYING THE MAIN IMPACTS FOR EACH AIR POLLUTANT Trucost identified which environmental impacts to consider for each air pollutant using the Impact Pathway Approach. Where impacts are excluded, such as the impact of particulate matter on crops and forestry, it was due to immateriality relative other effects. The table below summarizes which impacts are included for each air pollutant.
TABLE 14: ENVIRONMENTAL IMPACTS CONSIDERED Air Pollutant
Environmental Impacts
Particulate Matter (PM10)
Health
Ammonia (NH3)
Health and forestry
Nitrous Oxides (NOx)
Health, crops and forestry
Volatile Organic Compounds (VOCs)
Health, crops and forestry
Sulphur dioxide (SO2)
Health, freshwater, forestry and materials
93