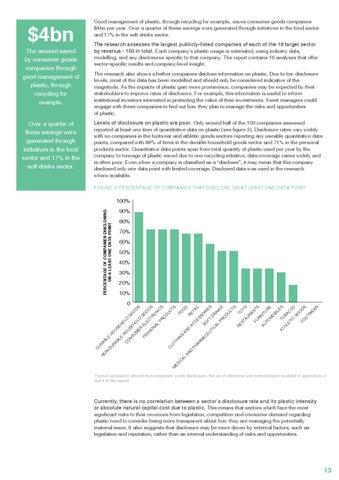
The research also shows whether companies disclose information on plastic. Due to low disclosure levels, most of the data has been modelled and should only be considered indicative of the magnitude. As the impacts of plastic gain more prominence, companies may be expected by their stakeholders to improve rates of disclosure. For example, this information is useful to inform institutional investors interested in protecting the value of their investments. Asset managers could engage with these companies to find out how they plan to manage the risks and opportunities of plastic. Levels of disclosure on plastic are poor. Only around half of the 100 companies assessed reported at least one item of quantitative data on plastic (see figure 3). Disclosure rates vary widely with no companies in the footwear and athletic goods sectors reporting any useable quantitative data points, compared with 88% of firms in the durable household goods sector and 71% in the personal products sector. Quantitative data points span from total quantity of plastic used per year by the company to tonnage of plastic saved due to one recycling initiative; data coverage varies widely and is often poor. Even when a company is classified as a “discloser”, it may mean that this company disclosed only one data point with limited coverage. Disclosed data was used in the research where available. FIGURE 3: PERCENTAGE Of COMPANIES THAT DISCLOSE ON AT LEAST ONe DATA POINT
100% PERCENTAGE OF COMPANIES DISCLOSING ON A LEAST ONE DATA POINT
90% 80% 70% 60% 50% 40% 30% 20%
ER
PE
M
SU N
O C
LE AB
-D
U
R
R AB
LE
H
H
O
O
U
U SE
SE
H
H
O
O LD
LD
G O
O D
S G EL O O EC R SO TR DS N O AL N IC PR S O D U C C LO TS M TH ED I F N IC O G AL O AN D AN D R D AC ET PH AI C ES AR L SO M AC SO R IE EU FT S TI D C R AL IN KS PR O D U C TS R TO ES YS TA U R AN FU TS R AU NIT U TO R E M O BI LE S AT TO H B LE AC TI C C O G O O FO D S O TW EA R
10% 0
O N
Over a quarter of these savings were generated through initiatives in the food sector and 17% in the soft drinks sector.
The research assesses the largest publicly-listed companies of each of the 16 target sector by revenue - 100 in total. Each company’s plastic usage is estimated, using industry data, modelling, and any disclosures specific to that company. The report contains 16 analyses that offer sector-specific results and company-level insight.
D U
The amount saved by consumer goods companies through good management of plastic, through recycling for example.
N
$4bn
Good management of plastic, through recycling for example, saves consumer goods companies $4bn per year. Over a quarter of these savings were generated through initiatives in the food sector and 17% in the soft drinks sector.
Trucost calculations derived from companies’ public disclosures (full set of references and methodologies available in appendices 3 and 4 of this report).
Currently, there is no correlation between a sector’s disclosure rate and its plastic intensity or absolute natural capital cost due to plastic. This means that sectors which face the most significant risks to their revenues from legislation, competition and consumer demand regarding plastic need to consider being more transparent about how they are managing the potentially material issue. It also suggests that disclosure may be more driven by external factors, such as legislation and reputation, rather than an internal understanding of risks and opportunities.
13