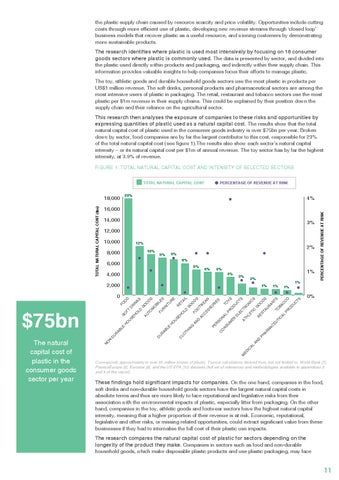
the plastic supply chain caused by resource scarcity and price volatility. Opportunities include cutting costs through more efficient use of plastic, developing new revenue streams through ‘closed loop’ business models that recover plastic as a useful resource, and winning customers by demonstrating more sustainable products. The research identifies where plastic is used most intensively by focusing on 16 consumer goods sectors where plastic is commonly used. The data is presented by sector, and divided into the plastic used directly within products and packaging, and indirectly within their supply chain. This information provides valuable insights to help companies focus their efforts to manage plastic. The toy, athletic goods and durable household goods sectors use the most plastic in products per US$1 million revenue. The soft drinks, personal products and pharmaceutical sectors are among the most intensive users of plastic in packaging. The retail, restaurant and tobacco sectors use the most plastic per $1m revenue in their supply chains. This could be explained by their position down the supply chain and their reliance on the agricultural sector. This research then analyses the exposure of companies to these risks and opportunities by expressing quantities of plastic used as a natural capital cost. The results show that the total natural capital cost of plastic used in the consumer goods industry is over $75bn per year. Broken down by sector, food companies are by far the largest contributor to this cost, responsible for 23% of the total natural capital cost (see figure 1).The results also show each sector’s natural capital intensity – or its natural capital cost per $1m of annual revenue. The toy sector has by far the highest intensity, at 3.9% of revenue. Figure 1: Total natural capital cost and intensity of selected sectors TOTAL NATURAL CAPITAL COST
23%
4%
16,000 14,000
3%
12,000 10,000
12% 10%
8,000
9% 8%
6,000
6%
4,000 2,000
6%
5%
4%
3%
1% 2%
O D
1%
1%
0%
D
R IN
FO
1%
O KS LD G O AU O D TO S M O B D I L FU U ES R R AB N IT LE U H R O E U SE R ET C H LO O AI LD L TH G IN O G O FO D AN S O D TW AC EA C ES R SO PE R I ES R SO C N O AL N T SU PR OY M S O ER D U EL C TS EC M TR AT ED H O LE IC N IC AL TI S C AN G R O D ES O PH D TA S AR U M R AC AN EU TS TO TI BA C AL C C PR O O D U C TS
1%
0
N
O N
-D
U
R AB
LE
H
O U
SE H
SO FT
$75bn
2% 9%
PERCENTAGE OF REVENUE AT RISK
TOTAL NATURAL CAPITAL COST ($m)
18,000
The natural capital cost of plastic in the consumer goods sector per year
PERCENTAGE OF REVENUE AT RISK
Corresponds approximately to over 80 million tonnes of plastic. Trucost calculations derived from, but not limited to, World Bank [7]; PlasticsEurope [8]; Eurostat [9], and the US EPA [10] datasets (full set of references and methodologies available in appendices 3 and 4 of this report).
These findings hold significant impacts for companies. On the one hand, companies in the food, soft drinks and non-durable household goods sectors have the largest natural capital costs in absolute terms and thus are more likely to face reputational and legislative risks from their association with the environmental impacts of plastic, especially litter from packaging. On the other hand, companies in the toy, athletic goods and footwear sectors have the highest natural capital intensity, meaning that a higher proportion of their revenue is at risk. Economic, reputational, legislative and other risks, or missing related opportunities, could extract significant value from these businesses if they had to internalise the full cost of their plastic use impacts. The research compares the natural capital cost of plastic for sectors depending on the longevity of the product they make. Companies in sectors such as food and non-durable household goods, which make disposable plastic products and use plastic packaging, may face
11