262
3,530
Tunisia
Mali
1,395
Togo
2,456 156
Burundi
Comoros
67,611
1,895
Sierra Leone
Eastern Africa
2,416
Senegal
5
Nigeria
Saint Helena
2,462 37,860
Niger
657
911 4,638
Liberia
Mauritania
518
3,094
Guinea-Bissau
4,981
Guinea
Côte d’Ivoire
Ghana
178 2,630
Cape Verde
271
4,284
Burkina Faso
Gambia
2,255
Benin
70,451
6,336
Sudan
Western Africa
8,953
Morocco
14
1,029
Libya
Western Sahara
21,514
Egypt
50,129
Northern Africa 8,753
229,895
Algeria
179,766
Africa
1950
Sub-Saharan Africa
Major area, region, country or area
193
2,940
85,130
1,578
2,187
3,048
5
45,926
3,250
854
5,248
1,116
593
3,541
6,742
373
3,638
211
4,882
2,420
85,611
33
4,221
8,319
11,626
1,349
27,903
10,800
64,251
286,729
222,478
1960
238
3,513
111,486
2,097
2,593
4,096
5
57,357
4,373
1,134
6,034
1,440
603
4,154
8,682
459
5,416
274
5,807
2,850
107,374
77
5,127
10,908
15,310
1,994
35,923
13,746
83,085
368,148
285,063
1970
329
4,130
148,549
2,667
3,162
5,414
5
75,543
5,871
1,518
7,246
1,923
835
4,407
10,923
630
8,501
300
7,212
3,611
139,766
150
6,457
15,097
19,567
3,063
44,952
18,811
108,098
482,803
374,705
1980
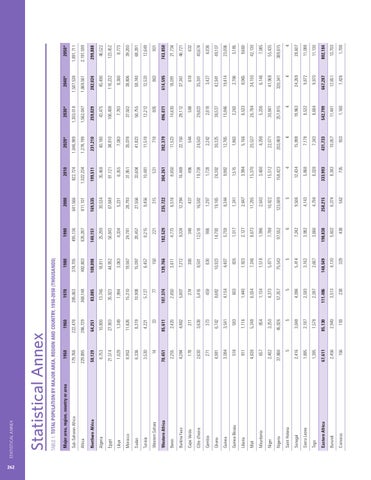
Table 1: Total Population by Major Area, Region and Country, 1950-2050 (thousands)
Statistical Annex
Statistical Annex
438
5,602
198,838
3,666
3,982
7,242
6
97,552
7,788
1,996
8,673
2,127
1,017
5,759
14,793
966
12,518
348
9,324
4,773
182,529
221
8,215
20,457
24,781
4,334
56,843
25,299
140,151
635,287
495,136
1990
562
6,374
258,215
4,794
4,143
9,506
5
123,689
10,922
2,643
11,295
2,847
1,241
8,344
19,165
1,297
16,582
437
12,294
6,518
235,722
315
9,456
27,556
28,793
5,231
67,648
30,534
169,535
811,101
641,566
2000
735
8,383
333,993
6,028
5,868
12,434
4
158,423
15,512
3,460
15,370
3,994
1,515
9,982
24,392
1,728
19,738
496
16,469
8,850
304,261
531
10,481
33,604
31,951
6,355
81,121
35,468
199,511
1,022,234
822,724
2010
933
10,057
431,733
7,343
7,178
15,998
4
203,869
22,071
4,298
20,537
5,166
1,863
12,765
30,325
2,242
24,503
544
22,150
11,523
392,379
718
11,518
41,823
35,078
7,083
94,810
40,180
231,210
1,278,199
1,046,989
2020*
1,160
11,441
542,799
8,684
8,532
19,963
4
257,815
30,841
5,200
26,784
6,533
2,263
15,946
36,537
2,818
29,823
588
29,112
14,630
496,071
805
12,212
50,755
37,502
7,783
106,498
43,475
259,029
1,562,047
1,303,018
2030*
1,426
12,651
667,287
9,970
9,872
24,269
4
320,341
41,968
6,146
34,100
8,065
2,706
19,414
42,941
3,427
35,301
618
37,361
18,091
614,595
863
12,533
59,740
38,806
8,360
116,232
45,490
282,024
1,869,561
1,587,538
2040*
1,700
13,703
802,184
11,130
11,088
28,607
4
389,615
55,435
7,085
42,130
9,660
3,185
23,006
49,107
4,036
40,674
632
46,721
21,734
743,850
901
12,649
68,391
39,200
8,773
123,452
46,522
299,888
2,191,599
1,891,711
2050*