▲ Soweto township, home to approximately 40% of Johannesburg’s population. ©Travis Lupick. Licensed under the Creative Commons Attribution-NonCommercial-ShareAlike 2.0 Generic License.
6,000 5,400 4,800 4,200 3,600 3,000 2,400 1,800 1,200 600 0
* 00 21
* 90 20
* 80 20
* 70 20
* 60 20
* 50 20
* 40 20
* 30 20
20 20
20
*
Africa Asia + Oceania Europe South America North America
10
Population by Major Region 2010-2100 (in millions, medium variant)
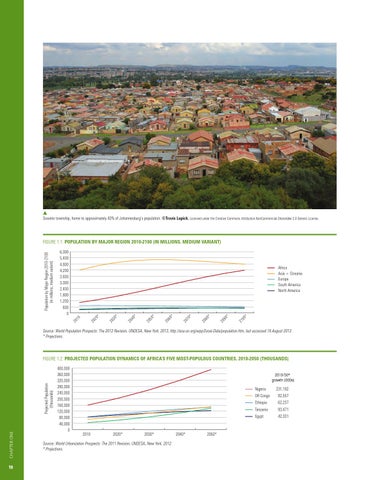
FIGURE 1.1: Population by Major Region 2010-2100 (in millions, medium variant)
Source: World Population Prospects: The 2012 Revision, UNDESA, New York, 2013, http://esa.un.org/wpp/Excel-Data/population.htm, last accessed 16 August 2013. * Projections.
CHAPTER ONE
Projected Population (thousands)
FIGURE 1.2: Projected Population Dynamics of Africa’s Five Most-populous Countries, 2010-2050 (thousands)
18
400,000 360,000 320,000 280,000 240,000 200,000 160,000 120,000 80,000 40,000 0
2010-50* growth (000s) Nigeria
2010
2020*
2030*
Source: World Urbanization Prospects: The 2011 Revision, UNDESA, New York, 2012. * Projections.
2040*
2050*
231,192
DR Congo
82,557
Ethiopia
62,237
Tanzania
93,471
Egypt
42,331