17
UNECE/FAO Forest Products Annual Market Review, 2014-2015
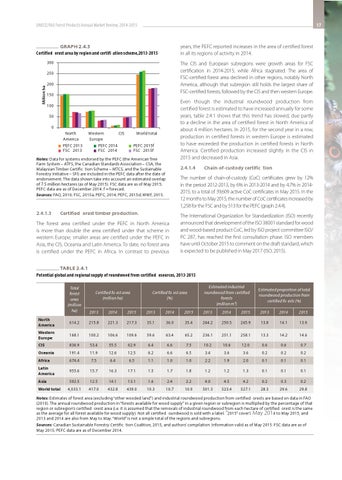
GRAPH 2.4.3 Certified orest area by region and certifi ation scheme,2013-2015
years, the PEFC reported increases in the area of certified forest in all its regions of activity in 2014.
300
The CIS and European subregions were growth areas for FSC certification in 2014-2015, while Africa stagnated. The area of FSC-certified forest area declined in other regions, notably North America, although that subregion still holds the largest share of FSC-certified forests, followed by the CIS and then western Europe.
Million ha
250 200 150
Even though the industrial roundwood production from certified forest is estimated to have increased annually for some years, table 2.4.1 shows that this trend has slowed, due partly to a decline in the area of certified forest in North America of about 4 million hectares. In 2015, for the second year in a row, production in certified forests in western Europe is estimated to have exceeded the production in certified forests in North America. Certified production increased slightly in the CIS in 2015 and decreased in Asia.
100 50 0 North America PEFC 2013 FSC 2013
Western CIS Europe PEFC 2014 FSC 2014
World total PEFC 2015f FSC 2015f
Notes: Data for systems endorsed by the PEFC (the American Tree Farm System – ATFS, the Canadian Standards Association – CSA, the Malaysian Timber Certific tion Scheme – MTCS, and the Sustainable Forestry Initiative – SFI) are included in the PEFC data after the date of endorsement. The data shown take into account an estimated overlap of 7.5 million hectares (as of May 2015). FSC data are as of May 2015; PEFC data are as of December 2014. f = forecast. Sources: FAO, 2010; FSC, 2015a; PEFC, 2014; PEFC, 2015d; WWF, 2015.
2.4.1.3
2.4.1.4
Chain-of-custody certific tion
The number of chain-of-custody (CoC) certificates grew by 12% in the period 2012-2013, by 6% in 2013-2014 and by 4.7% in 20142015, to a total of 39,609 active CoC certificates in May 2015. In the 12 months to May 2015, the number of CoC certificates increased by 1,258 for the FSC and by 513 for the PEFC (graph 2.4.4).
Certified orest timber production.
The forest area certified under the PEFC in North America is more than double the area certified under that scheme in western Europe; smaller areas are certified under the PEFC in Asia, the CIS, Oceania and Latin America. To date, no forest area is certified under the PEFC in Africa. In contrast to previous
The International Organization for Standardization (ISO) recently announced that development of the ISO 38001 standard for wood and wood-based product CoC, led by ISO project committee ISO/ PC 287, has reached the first consultation phase. ISO members have until October 2015 to comment on the draft standard, which is expected to be published in May 2017 (ISO, 2015).
TABLE 2.4.1 Potential global and regional supply of roundwood from certified esources, 2013-2015 Estimated industrial roundwood from certified forests (million m³)
Total forest area (million ha)
2013
2014
2015
2013
2014
2015
2013
2014
2015
2013
2014
2015
North America
614.2
215.8
221.3
217.3
35.1
36.0
35.4
244.2
250.5
245.9
13.8
14.1
13.9
Western Europe
168.1
100.2
106.6
109.6
59.6
63.4
65.2
236.1
251.1
258.1
13.3
14.2
14.6
Certified fo est area (million ha)
Certified fo est area (%)
Estimated proportion of total roundwood production from certified fo ests (%)
CIS
836.9
53.4
55.5
62.9
6.4
6.6
7.5
10.2
10.6
12.0
0.6
0.6
0.7
Oceania
191.4
11.9
12.6
12.5
6.2
6.6
6.5
3.4
3.6
3.6
0.2
0.2
0.2
Africa
674.4
7.5
6.4
6.5
1.1
1.0
1.0
2.2
1.9
2.0
0.1
0.1
0.1
Latin America
955.6
15.7
16.3
17.1
1.5
1.7
1.8
1.2
1.2
1.3
0.1
0.1
0.1
Asia World total
592.5
12.5
14.1
13.1
1.6
2.4
2.2
4.0
4.5
4.2
0.2
0.3
0.2
4,033.1
417.0
432.8
439.0
10.3
10.7
10.9
501.3
523.4
527.1
28.3
29.6
29.8
Notes: Estimates of forest area (excluding “other wooded land”) and industrial roundwood production from certified orests are based on data in FAO (2010). The annual roundwood production in “forests available for wood supply” in a given region or subregion is multiplied by the percentage of that region or subregion’s certified orest area (i.e. it is assumed that the removals of industrial roundwood from each hectare of certified orest is the same as the average for all forest available for wood supply). Not all certified oundwood is sold with a label. “2015” covers May 2014 to May 2015, and 2013 and 2014 are also from May to May. “World” is not a simple total of the regions and subregions. Sources: Canadian Sustainable Forestry Certific tion Coalition, 2015, and authors’ compilation. Information valid as of May 2015. FSC data are as of May 2015; PEFC data are as of December 2014.