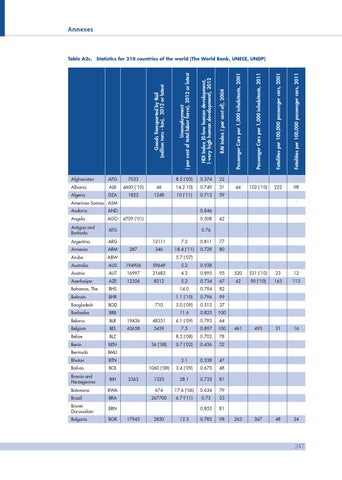
Annexes
8.5 (‘05)
0.374
22
Albania
ALB
4600 (‘10)
46
14.2 10)
0.749
31
Algeria
DZA
1822
1248
10 (‘11)
0.713
59
Fatalities per 100,000 passenger cars, 2011
7033
Fatalities per 100,000 passenger cars, 2001
RAI Index ( per cent of), 2004
AFG
Passenger Cars per 1,000 inhabitants, 2011
HDI Index (0-low human development, 1-very high human development), 2012
Afghanistan
Passenger Cars per 1,000 inhabitants, 2001
Unemployment ( per cent of total labor force), 2012 or latest
Statistics for 210 countries of the world (The World Bank, UNECE, UNDP)
Goods Transported by Rail (million tons - km), 2012 or latest
Table A2c.
44
102 (‘10)
222
98
American Samoa ASM Andorra
AND
Angola
AGO
Antigua and Barbuda
ATG
Argentina
ARG
` 0.846 4709 (‘01)
0.508
42
0.76
287
12111
7.2
0.811
77
346
18.4 (‘11)
0.729
80
Armenia
ARM
Aruba
ABW
Australia
AUS
194906
59649
5.2
0.938
Austria
AUT
16997
21683
4.3
0.895
95
520
531 (‘10)
23
12
Azerbaijan
AZE
12356
8212
5.2
0.734
67
42
90 (‘10)
163
113
461
493
31
16
263
367
48
24
5.7 (‘07)
Bahamas, The
BHS
14.0
0.794
82
Bahrain
BHR
1.1 (‘10)
0.796
99
Bangladesh
BGD
Barbados
BRB
Belarus
BLR
19436
Belgium
BEL
43658
Belize
BLZ
Benin
BEN
Bermuda
BMU
Bhutan
BTN
Bolivia
BOL
Bosnia and Herzegovina
BIH
710
2363
5.0 (‘09)
0.515
37
11.6
0.825
100
48351
6.1 (‘09)
0.793
64
5439
7.5
0.897
100
8.2 (‘08)
0.702
78
36 (‘08)
0.7 (‘02)
0.436
32
2.1
0.538
47
1060 (‘08)
3.4 (‘09)
0.675
48
1325
28.1
0.735
81
Botswana
BWA
674
17.6 (‘06)
0.634
79
Brazil
BRA
267700
6.7 (‘11)
0.73
53
Brunei Darussalam
BRN
0.855
81
Bulgaria
BGR
0.782
98
17943
2850
12.3
247