Timor-Leste
TLS
Togo
TGO
Tonga
1.6(’12) 39.29 (‘11)
2.3
26.5
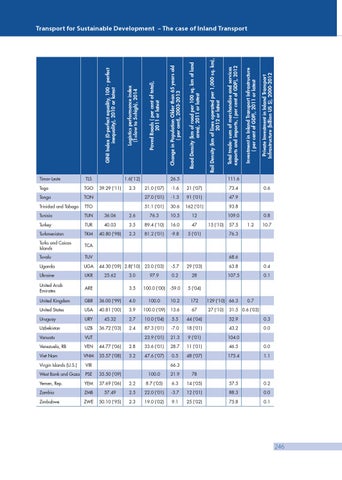
Private Investment in Inland Transport Infrastructure (billion US $), 2000-2012
Investment in Inland Transport Infrastructure ( per cent of GDP), 2011 or latest
Total trade- sum of merchandise and services exports and imports, ( per cent of GDP), 2012
Rail Density (km of lines operated per 1,000 sq. km), 2012 or latest
Road Density (km of road per 100 sq. km of land area), 2011 or latest
Change in Population Older than 65 years old ( per cent), 2003-2013
Paved Roads ( per cent of total), 2011 or latest
Logistics performance index (1=low to 5=high), 2014
GINI Index (0-perfect equality, 100 - perfect inequality), 2010 or latest
Transport for Sustainable Development – The case of Inland Transport
111.6
21.0 (‘07)
-1.6
21 (‘07)
73.4
TON
27.0 (‘01)
-1.3
91 (’01)
47.9
Trinidad and Tobago
TTO
51.1 (‘01)
30.6
162 (’01)
93.8
Tunisia
TUN
36.06
2.6
76.3
10.5
12
109.0
Turkey
TUR
40.03
3.5
89.4 (‘10)
16.0
47
Turkmenistan
TKM
40.80 (’98)
2.3
81.2 (‘01)
-9.8
5 (’01)
Turks and Caicos Islands
TCA
Tuvalu
TUV
Uganda
UGA
Ukraine
UKR
United Arab Emirates
ARE
United Kingdom
GBR
United States
15 (‘10)
57.5
0.6
0.8 1.2
10.7
76.3
68.6 44.30 (‘09) 2.8(’10)
23.0 (‘03)
-5.7
29 (‘03)
63.8
0.4
3.0
97.9
0.2
28
107.5
0.1
3.5
100.0 (‘00)
-59.0
5 (‘04)
36.00 (‘99)
4.0
100.0
10.2
172
129 (‘10) 66.3
USA
40.81 (‘00)
3.9
100.0 (‘09)
13.6
67
27 (‘10)
Uruguay
URY
45.32
2.7
10.0 (‘04)
5.5
44 (‘04)
52.9
0.3
Uzbekistan
UZB
36.72 (‘03)
2.4
87.3 (‘01)
-7.0
18 (’01)
43.2
0.0
Vanuatu
VUT
23.9 (‘01)
21.3
9 (’01)
104.0
Venezuela, RB
VEN
44.77 (‘06)
2.8
33.6 (‘01)
28.7
11 (’01)
46.5
0.0
Viet Nam
VNM
35.57 (‘08)
3.2
47.6 (‘07)
0.5
48 (‘07)
175.4
1.1
25.62
Virgin Islands (U.S.)
VIR
West Bank and Gaza
PSE
35.50 (‘09)
Yemen, Rep.
YEM
37.69 (‘06)
Zambia
ZMB
Zimbabwe
ZWE
0.7
31.5 0.6 (‘03)
66.3 100.0
21.9
78
2.2
8.7 (‘05)
6.3
14 (‘05)
57.5
0.2
57.49
2.5
22.0 (‘01)
-3.7
12 (’01)
88.3
0.0
50.10 (’95)
2.3
19.0 (‘02)
9.1
25 (’02)
75.8
0.1
246