Annexes
4 (‘10)
25.9
34.51 (‘08) 2.4(’10)
39.0 (‘02)
37.3
63 (’02)
86.1
35.30 (’95)
2.6
77.1 (‘10)
9.2
5 (‘10)
65.4
0.3
42.66 (‘09)
2.5
10.4 (‘01)
-2.4
4 (’01)
105.0
0.1
33.0 (‘02)
0.1
3.0
32.2
8.3
9
38.6
1.9
2.7
93.6 (‘09)
-7.4
26
78.8
0.8
12.6
11
41.7
1.8
100.0
16.8
137
99 (‘07) 112.3
0.8
2.4
55.6
-9.8
22
24 (‘10)
3.4
BHS
2.9
57.4 (‘01)
30.6
19 (‘01)
Bahrain
BHR
3.1
83.7
-4.6
546
Bangladesh
BGD
2.6
9.5 (‘03)
14.0
15 (‘09)
Barbados
BRB
100.0 (‘04)
-2.9
372 (‘01)
Belarus
BLR
26.48 (‘11)
2.6
86.5
-3.5
42
Belgium
BEL
32.97 (‘00)
4.0
78.2
4.4
504
Belize
BLZ
17.0 (‘01)
-4.7
13 (’01)
Benin
BEN
9.5 (04)
2.3
17 (‘01)
Bermuda
BMU
Bhutan
BTN
38.73 (‘12)
2.3
34.2
20.9
22
104.0
Bolivia
BOL
56.29 (‘08)
2.5
11.6
13.5
7
81.7
Bosnia and Herzegovina
BIH
36.21 (‘07)
2.7
92.1 (‘10)
27.9
45
102.9
27.82 (‘08)
Albania
ALB
Algeria
DZA
American Samoa
ASM
Andorra
AND
Angola
AGO
Antigua and Barbuda
ATG
Argentina
ARG
44.49
Armenia
ARM
31.30
Aruba
ABW
Australia
AUS
35.20 (’98)
3.8
43.3
Austria
AUT
29.15 (‘00)
3.6
Azerbaijan
AZE
33.71 (‘08)
Bahamas, The
Private Investment in Inland Transport Infrastructure (billion US $), 2000-2012
Road Density (km of road per 100 sq. km of land area), 2011 or latest
16.0
AFG
Investment in Inland Transport Infrastructure ( per cent of GDP), 2011 or latest
Change in Population Older than 65 years old ( per cent), 2003-2013
36.4 (‘10)
Afghanistan
Total trade- sum of merchandise and services exports and imports, ( per cent of GDP), 2012
Paved Roads ( per cent of total), 2011 or latest
2.1
GINI Index (0-perfect equality, 100 - perfect inequality), 2010 or latest
Logistics performance index (1=low to 5=high), 2014
Rail Density (km of lines operated per 1,000 sq. km), 2012 or latest
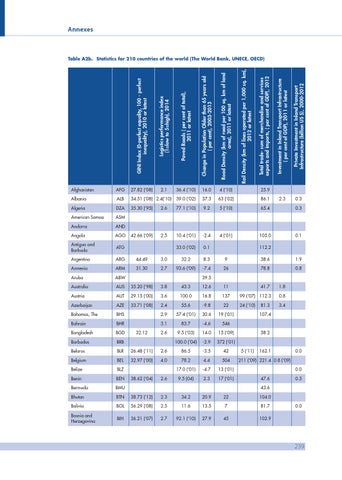
Table A2b. Statistics for 210 countries of the world (The World Bank, UNECE, OECD)
2.3
0.3
112.2
39.5
32.12
38.62 (‘04)
2.6
81.3 107.4
58.2
5 (‘11)
162.1
0.0
211 (‘09) 221.4 0.8 (‘09) 0.0 47.6
0.5
43.6
0.0
239