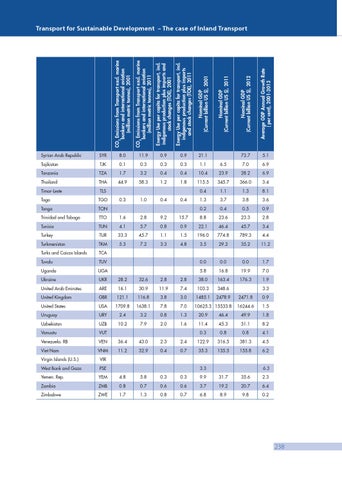
Energy Use per capita for transport, incl. indigenous production plus imports and stock changes (TOE), 2001
Energy Use per capita for transport, incl. indigenous production plus imports and stock changes (TOE), 2011
Nominal GDP (Current billion US $), 2001
SYR
8.0
11.9
0.9
0.9
21.1
Tajikistan
TJK
0.1
0.3
0.3
0.3
1.1
Tanzania
TZA
1.7
3.2
0.4
0.4
Thailand
THA
44.9
58.3
1.2
1.8
Timor-Leste
TLS 0.3
1.0
0.4
0.4
73.7
5.1
6.5
7.0
6.9
10.4
23.9
28.2
6.9
115.5
345.7
366.0
3.4
0.4
1.1
1.3
8.1
1.3
3.7
3.8
3.6
0.2
0.4
0.5
0.9
Nominal GDP (Current billion US $), 2011
Average GDP Annual Growth Rate ( per cent), 2001-2013
CO2 Emissions from Transport excl. marine bunkers and international aviation (million metric tonnes), 2011
Syrian Arab Republic
Nominal GDP (Current billion US $), 2012
CO2 Emissions from Transport excl. marine bunkers and international aviation (million metric tonnes), 2001
Transport for Sustainable Development – The case of Inland Transport
Togo
TGO
Tonga
TON
Trinidad and Tobago
TTO
1.6
2.8
9.2
15.7
8.8
23.6
23.3
2.8
Tunisia
TUN
4.1
5.7
0.8
0.9
22.1
46.4
45.7
3.4
Turkey
TUR
33.3
45.7
1.1
1.5
196.0
774.8
789.3
4.4
Turkmenistan
TKM
5.3
7.2
3.3
4.8
3.5
29.2
35.2
11.2
Turks and Caicos Islands
TCA
Tuvalu
TUV
0.0
0.0
0.0
1.7
Uganda
UGA
5.8
16.8
19.9
7.0
Ukraine
UKR
28.2
32.6
2.8
2.8
38.0
163.4
176.3
1.9
United Arab Emirates
ARE
16.1
30.9
11.9
7.4
103.3
348.6
United Kingdom
GBR
121.1
116.8
3.8
3.0
1485.1
2478.9
2471.8
0.9
United States
USA
1709.8
1638.1
7.8
7.0
10625.3 15533.8
16244.6
1.5
Uruguay
URY
2.4
3.2
0.8
1.3
20.9
46.4
49.9
1.8
Uzbekistan
UZB
10.2
7.9
2.0
1.6
11.4
45.3
51.1
8.2
Vanuatu
VUT
0.3
0.8
0.8
4.1
Venezuela. RB
VEN
36.4
43.0
2.3
2.4
122.9
316.5
381.3
4.5
Viet Nam
VNM
11.2
32.9
0.4
0.7
35.3
135.5
155.8
6.2
3.3
Virgin Islands (U.S.)
VIR
West Bank and Gaza
PSE
Yemen. Rep.
YEM
4.8
5.8
0.3
0.3
9.9
31.7
35.6
2.3
Zambia
ZMB
0.8
0.7
0.6
0.6
3.7
19.2
20.7
6.4
Zimbabwe
ZWE
1.7
1.3
0.8
0.7
6.8
8.9
9.8
0.2
3.3
6.3
238