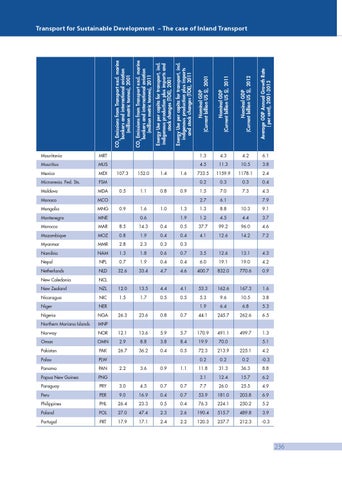
Nominal GDP (Current billion US $), 2001
Nominal GDP (Current billion US $), 2011
Nominal GDP (Current billion US $), 2012
Average GDP Annual Growth Rate ( per cent), 2001-2013
Energy Use per capita for transport, incl. indigenous production plus imports and stock changes (TOE), 2011
Energy Use per capita for transport, incl. indigenous production plus imports and stock changes (TOE), 2001
CO2 Emissions from Transport excl. marine bunkers and international aviation (million metric tonnes), 2011
CO2 Emissions from Transport excl. marine bunkers and international aviation (million metric tonnes), 2001
Transport for Sustainable Development – The case of Inland Transport
Mauritania
MRT
1.3
4.3
4.2
6.1
Mauritius
MUS
4.5
11.3
10.5
3.8
Mexico
MEX
733.5
1159.9
1178.1
2.4
Micronesia. Fed. Sts.
FSM
0.2
0.3
0.3
0.4
Moldova
MDA
1.5
7.0
7.3
4.3
Monaco
MCO
2.7
6.1
Mongolia
MNG
1.3
1.3
8.8
10.3
9.1
Montenegro
MNE
1.9
1.2
4.5
4.4
3.7
Morocco
MAR
8.5
14.3
0.4
0.5
37.7
99.2
96.0
4.6
Mozambique
MOZ
0.8
1.9
0.4
0.4
4.1
12.6
14.2
7.2
Myanmar
MMR
2.8
2.3
0.3
0.3
Namibia
NAM
1.3
1.8
0.6
0.7
3.5
12.6
13.1
4.3
Nepal
NPL
0.7
1.9
0.4
0.4
6.0
19.1
19.0
4.2
Netherlands
NLD
32.6
33.4
4.7
4.6
400.7
832.0
770.6
0.9
New Caledonia
NCL
New Zealand
NZL
12.0
13.5
4.4
4.1
53.3
162.6
167.3
1.6
Nicaragua
NIC
1.5
1.7
0.5
0.5
5.3
9.6
10.5
3.8
Niger
NER
1.9
6.4
6.8
5.3
Nigeria
NGA
Northern Mariana Islands
MNP
Norway Oman
107.3
0.5
0.9
152.0
1.1
1.6
1.4
0.8
1.0
0.6
1.6
0.9
7.9
26.3
23.6
0.8
0.7
44.1
245.7
262.6
6.5
NOR
12.1
13.6
5.9
5.7
170.9
491.1
499.7
1.3
OMN
2.9
8.8
3.8
8.4
19.9
70.0
Pakistan
PAK
26.7
36.2
0.4
0.5
72.3
213.9
225.1
4.2
Palau
PLW
0.2
0.2
0.2
-0.3
Panama
PAN
11.8
31.3
36.3
8.8
Papua New Guinea
PNG
3.1
12.4
15.7
6.2
Paraguay
PRY
3.0
4.5
0.7
0.7
7.7
26.0
25.5
4.9
Peru
PER
9.0
16.9
0.4
0.7
53.9
181.0
203.8
6.9
Philippines
PHL
26.4
23.3
0.5
0.4
76.3
224.1
250.2
5.2
Poland
POL
27.0
47.4
2.3
2.6
190.4
515.7
489.8
3.9
Portugal
PRT
17.9
17.1
2.4
2.2
120.3
237.7
212.3
-0.3
2.2
3.6
0.9
1.1
5.1
236