1.6
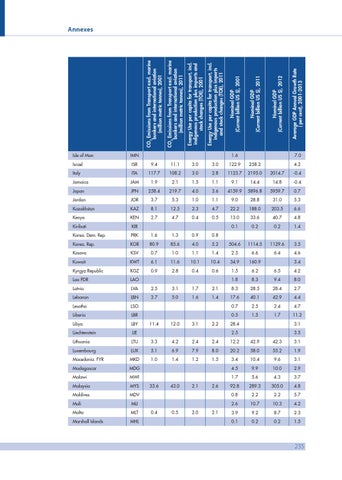
Average GDP Annual Growth Rate ( per cent), 2001-2013
Nominal GDP (Current billion US $), 2012
Nominal GDP (Current billion US $), 2011
Nominal GDP (Current billion US $), 2001
Energy Use per capita for transport, incl. indigenous production plus imports and stock changes (TOE), 2011
Energy Use per capita for transport, incl. indigenous production plus imports and stock changes (TOE), 2001
CO2 Emissions from Transport excl. marine bunkers and international aviation (million metric tonnes), 2011
CO2 Emissions from Transport excl. marine bunkers and international aviation (million metric tonnes), 2001
Annexes
Isle of Man
IMN
Israel
ISR
9.4
11.1
3.0
3.0
122.9
258.2
Italy
ITA
117.7
108.2
3.0
2.8
1123.7
2195.0
2014.7
-0.4
Jamaica
JAM
1.9
2.1
1.5
1.1
9.1
14.4
14.8
-0.4
Japan
JPN
258.4
219.7
4.0
3.6
4159.9
5896.8
5959.7
0.7
Jordan
JOR
3.7
5.3
1.0
1.1
9.0
28.8
31.0
5.3
Kazakhstan
KAZ
8.1
12.5
2.3
4.7
22.2
188.0
203.5
6.6
Kenya
KEN
2.7
4.7
0.4
0.5
13.0
33.6
40.7
4.8
Kiribati
KIR
0.1
0.2
0.2
1.4
Korea. Dem. Rep.
PRK
1.6
1.3
0.9
0.8
Korea. Rep.
KOR
80.9
85.6
4.0
5.2
504.6
1114.5
1129.6
3.5
Kosovo
KSV
0.7
1.0
1.1
1.4
2.5
6.6
6.4
4.6
Kuwait
KWT
6.1
11.6
10.1
10.4
34.9
160.9
Kyrgyz Republic
KGZ
0.9
2.8
0.4
0.6
1.5
6.2
6.5
4.2
Lao PDR
LAO
1.8
8.3
9.4
8.0
Latvia
LVA
2.5
3.1
1.7
2.1
8.3
28.5
28.4
2.7
Lebanon
LBN
3.7
5.0
1.6
1.4
17.6
40.1
42.9
4.4
Lesotho
LSO
0.7
2.5
2.4
4.7
Liberia
LBR
0.5
1.5
1.7
11.2
Libya
LBY
Liechtenstein
LIE
Lithuania
LTU
3.3
4.2
2.4
2.4
12.2
42.9
42.3
3.1
Luxembourg
LUX
5.1
6.9
7.9
8.0
20.2
58.0
55.2
1.9
Macedonia. FYR
MKD
1.0
1.4
1.2
1.5
3.4
10.4
9.6
3.1
Madagascar
MDG
4.5
9.9
10.0
2.9
Malawi
MWI
1.7
5.6
4.3
3.7
Malaysia
MYS
92.8
289.3
305.0
4.8
Maldives
MDV
0.8
2.2
2.2
5.7
Mali
MLI
2.6
10.7
10.3
4.2
Malta
MLT
3.9
9.2
8.7
2.3
Marshall Islands
MHL
0.1
0.2
0.2
1.5
11.4
33.6
0.4
12.0
43.0
0.5
3.1
2.1
2.0
2.2
2.6
2.1
7.0 4.2
3.4
28.4
3.1
2.5
3.5
235