Transport for Sustainable Development – The case of Inland Transport
ANNEX II
1.5
2.3
0.5
Algeria
DZA
16.9
32.3
0.8
American Samoa
ASM
Andorra
AND
Angola
AGO
Antigua and Barbuda
ATG
Argentina
ARG
36.5
46.9
1.6
Armenia
ARM
0.6
1.3
0.7
Aruba
ABW
Australia
AUS
73.7
86.0
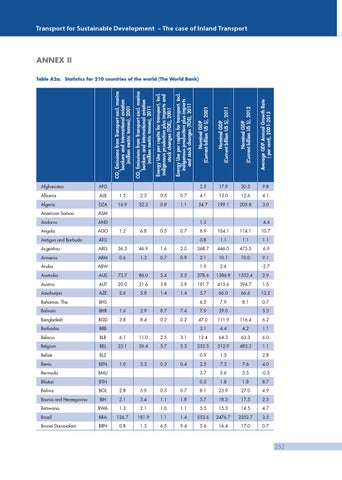
Average GDP Annual Growth Rate ( per cent), 2001-2013
ALB
Nominal GDP (Current billion US $), 2012
Albania
Nominal GDP (Current billion US $), 2011
AFG
Nominal GDP (Current billion US $), 2001
Afghanistan
Energy Use per capita for transport, incl. indigenous production plus imports and stock changes (TOE), 2011
Energy Use per capita for transport, incl. indigenous production plus imports and stock changes (TOE), 2001
CO2 Emissions from Transport excl. marine bunkers and international aviation (million metric tonnes), 2011
CO2 Emissions from Transport excl. marine bunkers and international aviation (million metric tonnes), 2001
Table A2a. Statistics for 210 countries of the world (The World Bank)
2.5
17.9
20.5
9.8
0.7
4.1
13.0
12.6
4.1
1.1
54.7
199.1
205.8
3.0
1.3 1.2
6.8
0.5
5.4
0.7
4.4
8.9
104.1
114.1
10.7
0.8
1.1
1.1
1.1
2.0
268.7
446.0
475.5
6.9
0.9
2.1
10.1
10.0
9.1
1.9
2.6
5.5
378.6
1386.9
1532.4
-2.7 2.9
Austria
AUT
20.0
21.6
3.8
3.9
191.7
415.6
394.7
1.5
Azerbaijan
AZE
2.6
5.8
1.4
1.4
5.7
66.0
66.6
13.2
Bahamas. The
BHS
6.5
7.9
8.1
0.7
Bahrain
BHR
1.6
2.9
8.7
7.4
7.9
29.0
Bangladesh
BGD
3.8
8.4
0.2
0.2
47.0
111.9
116.4
6.2
Barbados
BRB
3.1
4.4
4.2
1.1
Belarus
BLR
6.1
11.0
2.5
3.1
12.4
64.3
63.3
6.0
Belgium
BEL
25.1
26.4
5.7
5.3
232.5
512.9
483.3
1.1
Belize
BLZ
0.9
1.5
Benin
BEN
2.5
7.3
7.6
4.0
Bermuda
BMU
3.7
5.6
5.5
-0.5
Bhutan
BTN
0.5
1.8
1.8
8.7
Bolivia
BOL
2.8
5.9
0.3
0.7
8.1
23.9
27.0
4.9
Bosnia and Herzegovina
BIH
2.1
3.4
1.1
1.8
5.7
18.3
17.5
2.5
Botswana
BWA
1.3
2.1
1.0
1.1
5.5
15.3
14.5
4.7
Brazil
BRA
126.7
181.9
1.1
1.4
553.6
2476.7
2252.7
3.5
Brunei Darussalam
BRN
0.8
1.3
6.5
9.4
5.6
16.4
17.0
0.7
1.0
3.3
0.3
0.4
5.3
2.8
232