2. General Trends Controlling Transport Growth and Demand
2.3.2. Global and Regional Trends in Energy Consumption
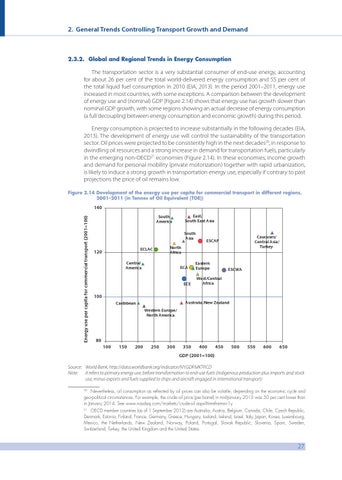
The transportation sector is a very substantial consumer of end-use energy, accounting for about 26 per cent of the total world-delivered energy consumption and 55 per cent of the total liquid fuel consumption in 2010 (EIA, 2013). In the period 2001–2011, energy use increased in most countries, with some exceptions. A comparison between the development of energy use and (nominal) GDP (Figure 2.14) shows that energy use has growth slower than nominal GDP growth, with some regions showing an actual decrease of energy consumption (a full ‘decoupling’ between energy consumption and economic growth) during this period. Energy consumption is projected to increase substantially in the following decades (EIA, 2013). The development of energy use will control the sustainability of the transportation sector. Oil prices were projected to be consistently high in the next decades20, in response to dwindling oil resources and a strong increase in demand for transportation fuels, particularly in the emerging non-OECD21 economies (Figure 2.14). In these economies, income growth and demand for personal mobility (private motorization) together with rapid urbanization, is likely to induce a strong growth in transportation energy use, especially if contrary to past projections the price of oil remains low. Figure 2.14 Development of the energy use per capita for commercial transport in different regions, 2001–2011 (in Tonnes of Oil Equivalent (TOE))
Energy use per capita for commercial transport (2001=100)
140 East/ South East Asia
South America
South Asia ECLAC
120
Caucuses/ Central Asia/ Turkey
ESCAP
North Africa
Central America
ECA ECE
Eastern Europe
ESCWA
West/Central Africa
100 Australia/New Zealand
Caribbean Western Europe/ North America
80 100
150
200
250
300
350
400
450
500
550
600
650
GDP (2001=100) Source: World Bank, http://data.worldbank.org/indicator/NY.GDP.MKTP.CD Note: It refers to primary energy use, before transformation to end-use fuels (indigenous production plus imports and stock use, minus exports and fuels supplied to ships and aircraft engaged in international transport) 20 Nevertheless, oil consumption as reflected by oil prices can also be volatile, depending on the economic cycle and geo-political circumstances. For example, the crude oil price (per barrel) in mid-January 2015 was 50 per cent lower than in January 2014. See www.nasdaq.com/markets/crude-oil.aspx?timeframe=1y
OECD member countries (as of 1 September 2012) are Australia, Austria, Belgium, Canada, Chile, Czech Republic, Denmark, Estonia, Finland, France, Germany, Greece, Hungary, Iceland, Ireland, Israel, Italy, Japan, Korea, Luxembourg, Mexico, the Netherlands, New Zealand, Norway, Poland, Portugal, Slovak Republic, Slovenia, Spain, Sweden, Switzerland, Turkey, the United Kingdom and the United States. 21
27