Transport for Sustainable Development – The case of Inland Transport
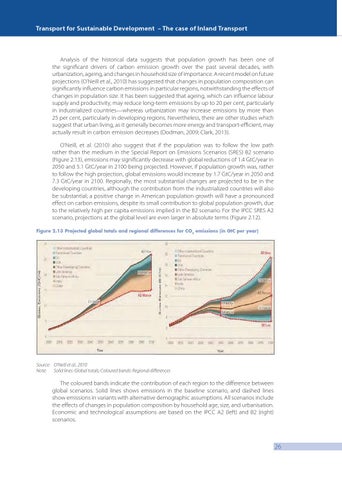
Analysis of the historical data suggests that population growth has been one of the significant drivers of carbon emission growth over the past several decades, with urbanization, ageing, and changes in household size of importance. A recent model on future projections (O’Neill et al., 2010) has suggested that changes in population composition can significantly influence carbon emissions in particular regions, notwithstanding the effects of changes in population size. It has been suggested that ageing, which can influence labour supply and productivity, may reduce long-term emissions by up to 20 per cent, particularly in industrialized countries—whereas urbanization may increase emissions by more than 25 per cent, particularly in developing regions. Nevertheless, there are other studies which suggest that urban living, as it generally becomes more energy and transport-efficient, may actually result in carbon emission decreases (Dodman, 2009; Clark, 2013). O’Neill, et al. (2010) also suggest that if the population was to follow the low path rather than the medium in the Special Report on Emissions Scenarios (SRES) B2 scenario (Figure 2.13), emissions may significantly decrease with global reductions of 1.4 GtC/year in 2050 and 5.1 GtC/year in 2100 being projected. However, if population growth was, rather to follow the high projection, global emissions would increase by 1.7 GtC/year in 2050 and 7.3 GtC/year in 2100. Regionally, the most substantial changes are projected to be in the developing countries, although the contribution from the industrialized countries will also be substantial; a positive change in American population growth will have a pronounced effect on carbon emissions, despite its small contribution to global population growth, due to the relatively high per capita emissions implied in the B2 scenario. For the IPCC SRES A2 scenario, projections at the global level are even larger in absolute terms (Figure 2.12). Figure 2.13 Projected global totals and regional differences for CO2 emissions (in GtC per year)
Source: O’Neill et al., 2010 Note: Solid lines: Global totals; Coloured bands: Regional differences
The coloured bands indicate the contribution of each region to the difference between global scenarios. Solid lines shows emissions in the baseline scenario, and dashed lines show emissions in variants with alternative demographic assumptions. All scenarios include the effects of changes in population composition by household age, size, and urbanisation. Economic and technological assumptions are based on the IPCC A2 (left) and B2 (right) scenarios.
26