Transport for Sustainable Development – The case of Inland Transport
Table 2.2
Largest urban agglomerations by population size in 2015 and in 2030 (DESA, 2014) 2015
2030
Urban Population Rank Agglomeration (millions)
Rank
Region
Country
1
UNESCAP
Japan
Tokyo
38.00
2
UNESCAP
India
Delhi
3
UNESCAP
China
Shanghai
Urban Population Agglomeration (millions)
Region
Country
1
UNESCAP
Japan
Tokyo
37.19
25.70
2
UNESCAP
India
Delhi
36.06
23.74
3
UNESCAP
China
Shanghai
30.75
4
UNECLAC
Brazil
São Paulo
21.07
4
UNESCAP
India
Mumbai
27.80
5
UNESCAP
India
Mumbai
21.04
5
UNESCAP
China
Beijing
27.71
6
UNECLAC
Mexico
Mexico City
21.00
6
UNESCAP
Bangladesh
Dhaka
27.37
7
UNESCAP
China
Beijing
20.38
7
UNESCAP
Pakistan
Karachi
24.84
8
UNESCAP
Japan
Osaka
20.24
8
UNECA
Egypt
Cairo
24.50
9
UNECA
Egypt
Cairo
18.77
9
UNECA
Nigeria
Lagos
24.24
10
UNECE
USA
New York
18.59
10
UNECLAC
Mexico
Mexico City
23.86
Source: DESA, 2014
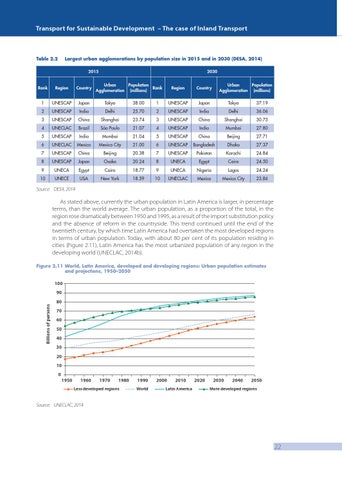
As stated above, currently the urban population in Latin America is larger, in percentage terms, than the world average. The urban population, as a proportion of the total, in the region rose dramatically between 1950 and 1995, as a result of the import substitution policy and the absence of reform in the countryside. This trend continued until the end of the twentieth century, by which time Latin America had overtaken the most developed regions in terms of urban population. Today, with about 80 per cent of its population residing in cities (Figure 2.11), Latin America has the most urbanized population of any region in the developing world (UNECLAC, 2014b). Figure 2.11 World, Latin America, developed and developing regions: Urban population estimates and projections, 1950–2050
100
Billions of persons
90 80 70 60 50 40 30 20 10 0
1950
1960
1970
1980
Less developed regions
1990 World
2000
2010
Latin America
2020
2030
2040
2050
More developed regions
Source: UNECLAC, 2014
22