2. General Trends Controlling Transport Growth and Demand
2012, succeeded in reducing their record unemployment registered during the decade by 41 per cent, reaching levels of 6.6 per cent and 7 per cent respectively. Available statistics show that the volume of road and rail freight transport has experienced growth at the UNESCAP regional level since the early 2000s. While a number of countries Bangladesh (-9 per cent), Japan (-9 per cent), the Republic of Korea (-8) and Thailand (-27 per cent) registered freight volume declines in rail transport during the period; the highest increases in rail freight volume transport for the 2002–2012 period were reported by Malaysia (239 per cent), Mongolia (166 per cent), Viet Nam (108 per cent) and India (105 per cent). China’s rapid expansion of road infrastructure was followed in step by high interannual increases in road freight transport volumes, totalling more than 738 per cent in 2011 compared to 2001 levels, reaching 5,137,474 million-ton kilometres of transported goods. Significant volume increases were registered in Australia (47 per cent) and Viet Nam (193 per cent), while Japan was hard hit by the effects of the economic crisis in this area (and possibly the aftermath of the devastating tsunami of 2010) with road freight transport volumes in 2010 reduced by 25 per cent compared to 2009 levels (Wilmsmeier and Guidry, 2013). UNESCWA region
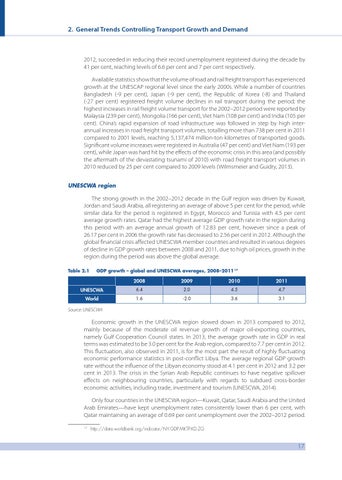
The strong growth in the 2002–2012 decade in the Gulf region was driven by Kuwait, Jordan and Saudi Arabia, all registering an average of above 5 per cent for the period, while similar data for the period is registered in Egypt, Morocco and Tunisia with 4.5 per cent average growth rates. Qatar had the highest average GDP growth rate in the region during this period with an average annual growth of 12.83 per cent, however since a peak of 26.17 per cent in 2006 the growth rate has decreased to 2.56 per cent in 2012. Although the global financial crisis affected UNESCWA member countries and resulted in various degrees of decline in GDP growth rates between 2008 and 2011, due to high oil prices, growth in the region during the period was above the global average. Table 2.1
GDP growth – global and UNESCWA averages, 2008–2011 17
2008
2009
2010
2011
UNESCWA
6.4
2.0
4.5
4.7
World
1.6
-2.0
3.6
3.1
Source: UNESCWA
Economic growth in the UNESCWA region slowed down in 2013 compared to 2012, mainly because of the moderate oil revenue growth of major oil-exporting countries, namely Gulf Cooperation Council states. In 2013, the average growth rate in GDP in real terms was estimated to be 3.0 per cent for the Arab region, compared to 7.7 per cent in 2012. This fluctuation, also observed in 2011, is for the most part the result of highly fluctuating economic performance statistics in post-conflict Libya. The average regional GDP growth rate without the influence of the Libyan economy stood at 4.1 per cent in 2012 and 3.2 per cent in 2013. The crisis in the Syrian Arab Republic continues to have negative spillover effects on neighbouring countries, particularly with regards to subdued cross-border economic activities, including trade, investment and tourism (UNESCWA, 2014). Only four countries in the UNESCWA region—Kuwait, Qatar, Saudi Arabia and the United Arab Emirates—have kept unemployment rates consistently lower than 6 per cent, with Qatar maintaining an average of 0.69 per cent unemployment over the 2002–2012 period. 17
http://data.worldbank.org/indicator/NY.GDP.MKTP.KD.ZG
17