2. General Trends Controlling Transport Growth and Demand
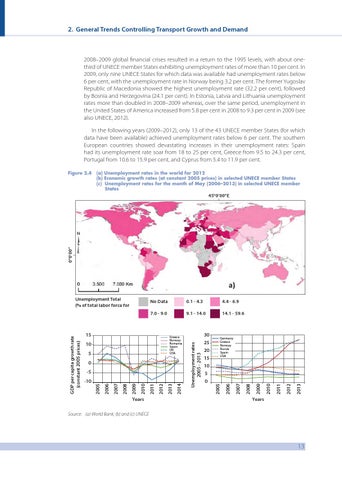
2008–2009 global financial crises resulted in a return to the 1995 levels, with about onethird of UNECE member States exhibiting unemployment rates of more than 10 per cent. In 2009, only nine UNECE States for which data was available had unemployment rates below 6 per cent, with the unemployment rate in Norway being 3.2 per cent. The former Yugoslav Republic of Macedonia showed the highest unemployment rate (32.2 per cent), followed by Bosnia and Herzegovina (24.1 per cent). In Estonia, Latvia and Lithuania unemployment rates more than doubled in 2008–2009 whereas, over the same period, unemployment in the United States of America increased from 5.8 per cent in 2008 to 9.3 per cent in 2009 (see also UNECE, 2012). In the following years (2009–2012), only 13 of the 43 UNECE member States (for which data have been available) achieved unemployment rates below 6 per cent. The southern European countries showed devastating increases in their unemployment rates: Spain had its unemployment rate soar from 18 to 25 per cent, Greece from 9.5 to 24.3 per cent, Portugal from 10.6 to 15.9 per cent, and Cyprus from 5.4 to 11.9 per cent. Figure 2.4
(a) Unemployment rates in the world for 2012 (b) Economic growth rates (at constant 2005 prices) in selected UNECE member States (c) Unemployment rates for the month of May (2006–2013) in selected UNECE member States
0°0’00’’
45°0’00’’E
a) No Data
0.1 - 4.3
4.4 - 6.9
7.0 - 9.0
9.1 - 14.0
14.1 - 59.6
Years
10
2013
2012
2011
0
2010
5 2009
2014
2013
2012
2011
2010
2009
2008
2007
-10
2006
-5
15
2008
0
20
Germany Greece Norway Russia Spain USA
2007
5
25
2006
10
30
2005
Greece Norway Romania Spain UK USA
Unemployment rates 2005 - 2013
15
2005
GDP per capita growth rate (constant 2005 prices)
Unemployment Total (% of total labor force for
Years
Source: (a) World Bank; (b) and (c) UNECE
13