2. General Trends Controlling Transport Growth and Demand
In addition, the outsourcing/offshoring of jobs requiring mid-level skills that have been facilitated by changes in global production patterns and improved transport sector efficiency can affect considerably labour markets (Abel and Deitz, 2012). At the same time, continued growth in emerging economies can be a growth engine for the world economy, providing also opportunities for other developing countries; nevertheless, the gravity shift to China and India (the major drivers of this process) can also change the character of end markets and pose new challenges for economic development. Globalization may also increase the cyclical interdependence of national economies making them more vulnerable to external shocks. Changes in consumer demand in end-markets are likely to be transmitted in real time to producers, with large implications for economic growth, employment and the transport sector (Cattaneo et al., 2010; Keane, 2012). Figure 2.3
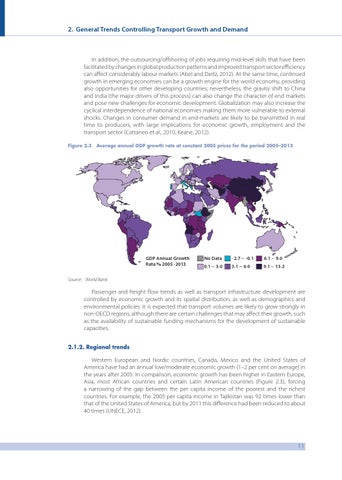
Average annual GDP growth rate at constant 2005 prices for the period 2005–2013
GDP Annual Growth Rate % 2005 -2013
No Data
-2.7 - -0.1
6.1 - 9.0
0.1 - 3.0
3.1 - 6.0
9.1 - 13.2
Source: World Bank
Passenger and freight flow trends as well as transport infrastructure development are controlled by economic growth and its spatial distribution, as well as demographics and environmental policies. It is expected that transport volumes are likely to grow strongly in non-OECD regions, although there are certain challenges that may affect their growth, such as the availability of sustainable funding mechanisms for the development of sustainable capacities. 2.1.2. Regional trends
Western European and Nordic countries, Canada, Mexico and the United States of America have had an annual low/moderate economic growth (1–2 per cent on average) in the years after 2005. In comparison, economic growth has been higher in Eastern Europe, Asia, most African countries and certain Latin American countries (Figure 2.3), forcing a narrowing of the gap between the per capita income of the poorest and the richest countries. For example, the 2005 per capita income in Tajikistan was 92 times lower than that of the United States of America, but by 2011 this difference had been reduced to about 40 times (UNECE, 2012).
11