Annexes
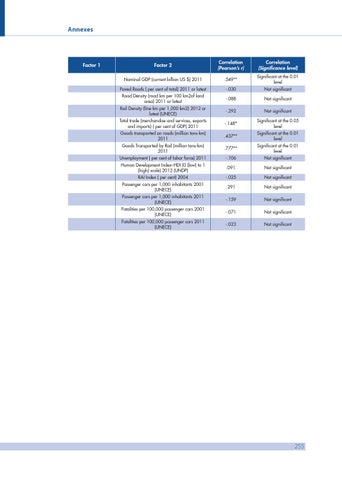
Factor 1
Factor 2
Correlation (Pearson’s r)
Correlation (Significance level)
Nominal GDP (current billion US $) 2011
.549**
Significant at the 0.01 level
Paved Roads ( per cent of total) 2011 or latest
-.030
Not significant
Road Density (road km per 100 km2of land area) 2011 or latest
-.088
Not significant
Rail Density (line km per 1,000 km2) 2012 or latest (UNECE)
-.292
Not significant
Total trade (merchandise and services, exports and imports) ( per cent of GDP) 2011
-.148*
Significant at the 0.05 level
Goods transported on roads (million tons-km) 2011
.437**
Significant at the 0.01 level
Goods Transported by Rail (million tons-km) 2011
.777**
Significant at the 0.01 level
Unemployment ( per cent of labor force) 2011
-.106
Not significant
Human Development Index–HDI (0 (low) to 1 (high) scale) 2012 (UNDP)
.091
Not significant
RAI Index ( per cent) 2004
-.025
Not significant
Passenger cars per 1,000 inhabitants 2001 (UNECE)
.291
Not significant
Passenger cars per 1,000 inhabitants 2011 (UNECE)
-.159
Not significant
Fatalities per 100,000 passenger cars 2001 (UNECE)
-.071
Not significant
Fatalities per 100,000 passenger cars 2011 (UNECE)
-.023
Not significant
255