Transport for Sustainable Development – The case of Inland Transport
Table A2d
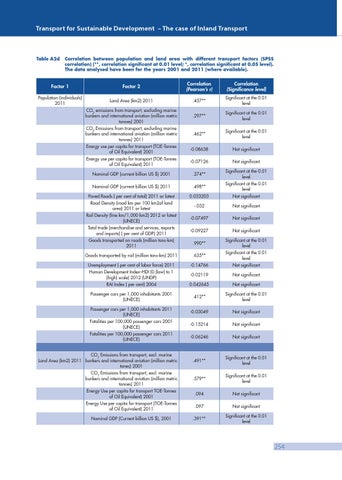
Correlation between population and land area with different transport factors (SPSS correlation) (**, correlation significant at 0.01 level; *, correlation significant at 0.05 level). The data analysed have been for the years 2001 and 2011 (where available).
Factor 1
Factor 2
Correlation (Pearson’s r)
Correlation (Significance level)
Population (individuals) 2011
Land Area (km2) 2011
.457**
Significant at the 0.01 level
CO2 emissions from transport, excluding marine bunkers and international aviation (million metric tonnes) 2001
.297**
Significant at the 0.01 level
CO2 Emissions from transport, excluding marine bunkers and international aviation (million metric tonnes) 2011
.462**
Significant at the 0.01 level
Energy use per capita for transport (TOE-Tonnes of Oil Equivalent) 2001
-0.08638
Not significant
Energy use per capita for transport (TOE-Tonnes of Oil Equivalent) 2011
-0.07126
Not significant
Nominal GDP (current billion US $) 2001
.274**
Significant at the 0.01 level
Nominal GDP (current billion US $) 2011
.498**
Significant at the 0.01 level
Paved Roads ( per cent of total) 2011 or latest
0.033203
Not significant
Road Density (road km per 100 km2of land area) 2011 or latest
-.032
Not significant
Rail Density (line km/1,000 km2) 2012 or latest (UNECE)
-0.07497
Not significant
Total trade (merchandise and services, exports and imports) ( per cent of GDP) 2011
-0.09227
Not significant
Goods transported on roads (million tons-km) 2011
.990**
Significant at the 0.01 level
Goods transported by rail (million tons-km) 2011
.635**
Significant at the 0.01 level
Unemployment ( per cent of labor force) 2011
-0.14766
Not significant
Human Development Index–HDI (0 (low) to 1 (high) scale) 2012 (UNDP)
-0.02119
Not significant
RAI Index ( per cent) 2004
0.042645
Not significant
Passenger cars per 1,000 inhabitants 2001 (UNECE)
.412**
Significant at the 0.01 level
Passenger cars per 1,000 inhabitants 2011 (UNECE)
-0.03049
Not significant
Fatalities per 100,000 passenger cars 2001 (UNECE)
-0.15214
Not significant
Fatalities per 100,000 passenger cars 2011 (UNECE)
-0.06246
Not significant
CO2 Emissions from transport, excl. marine Land Area (km2) 2011 bunkers and international aviation (million metric tones) 2001
.491**
Significant at the 0.01 level
CO2 Emissions from transport, excl. marine bunkers and international aviation (million metric tonnes) 2011
.579**
Significant at the 0.01 level
Energy Use per capita for transport TOE-Tonnes of Oil Equivalent) 2001
.094
Not significant
Energy Use per capita for transport (TOE-Tonnes of Oil Equivalent) 2011
.097
Not significant
Nominal GDP (Current billion US $), 2001
.391**
Significant at the 0.01 level
254