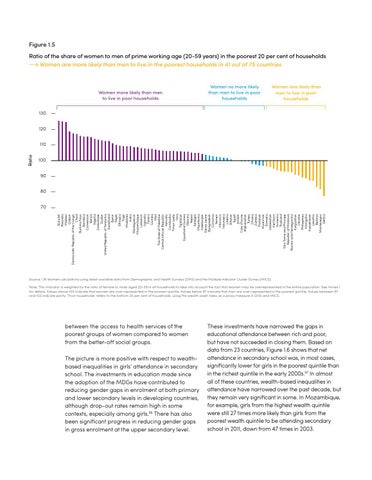
Figure 1.5 Ratio of the share of women to men of prime working age (20-59 years) in the poorest 20 per cent of households Women are more likely than men to live in the poorest households in 41 out of 75 countries
Women more likely than men to live in poor households
Women no more likely than men to live in poor households
Women less likely than men to live in poor households
130 120
Ratio
110 100 90 80
Burundi Rwanda Malawi Gabon Democratic Republic of the Congo Chad Burkina Faso Namibia Cameroon Kenya Nigeria Zimbabwe Sudan United Republic of Tanzania Swaziland Benin Niger Ethiopia Togo Maldives India Madagascar Mozambique Lebanon Uganda Tunisia Guinea Mali The State of Palestine Central African Republic Vanuatu Cambodia Timor Leste Iraq Tajikistan Equatorial Guinea Albania Nepal Senegal Mauritania Azerbaijan Sierra Leone Bangladesh Comoros Yemen Morocco Indonesia Liberia Bhutan Egypt Jordan Cote d’Ivoire Afghanistan Turkey Ghana Zambia Pakistan Myanmar Somalia Uzbekistan Viet Nam Armenia Thailand São Tomé and Príncipe Republic of Moldova Bosnia and Herzegovina Kyrgyzstan Ukraine Philippines Mongolia Kazakhstan Lesotho Belarus Montenegro Serbia
70
Source: UN Women calculations using latest available data from Demographic and Health Surveys (DHS) and the Multiple Indicator Cluster Survey (MICS). Note: This indicator is weighted by the ratio of female to male aged 20-59 in all households to take into account the fact that women may be overrepresented in the entire population. See Annex 1 for details. Values above 103 indicate that women are over-represented in the poorest quintile. Values below 97 indicate that men are over-represented in the poorest quintile. Values between 97 and 103 indicate parity. ‘Poor households’ refers to the bottom 20 per cent of households, using the wealth asset index as a proxy measure in DHS and MICS.
between the access to health services of the poorest groups of women compared to women from the better-off social groups. The picture is more positive with respect to wealthbased inequalities in girls’ attendance in secondary school. The investments in education made since the adoption of the MDGs have contributed to reducing gender gaps in enrolment at both primary and lower secondary levels in developing countries, although drop-out rates remain high in some contexts, especially among girls.96 There has also been significant progress in reducing gender gaps in gross enrolment at the upper secondary level.
These investments have narrowed the gaps in educational attendance between rich and poor, but have not succeeded in closing them. Based on data from 23 countries, Figure 1.6 shows that net attendance in secondary school was, in most cases, significantly lower for girls in the poorest quintile than in the richest quintile in the early 2000s.97 In almost all of these countries, wealth-based inequalities in attendance have narrowed over the past decade, but they remain very significant in some. In Mozambique, for example, girls from the highest wealth quintile were still 27 times more likely than girls from the poorest wealth quintile to be attending secondary school in 2011, down from 47 times in 2003.