Annexes
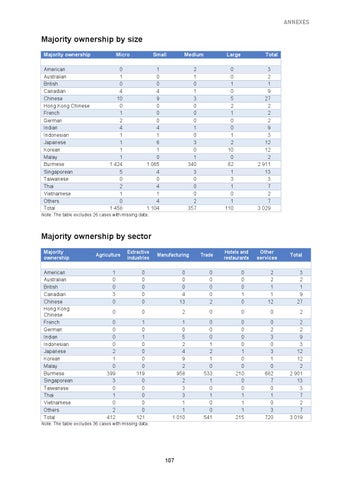
Majority ownership by size Majority ownership American Australian British Canadian Chinese Hong Kong Chinese French German Indian Indonesian Japanese Korean Malay Burmese Singaporean Taiwanese Thai Vietnamese Others Total
Micro
Small
0 1 0 4 10 0 1 2 4 1 1 1 1 1 424 5 0 2 1 0 1 458
Medium
1 0 0 4 9 0 0 0 4 1 6 1 0 1 065 4 0 4 1 4 1 104
Large
2 1 0 1 3 0 0 0 1 0 3 0 1 340 3 0 0 0 2 357
Total
0 0 1 0 5 2 1 0 0 1 2 10 0 82 1 3 1 0 1 110
3 2 1 9 27 2 2 2 9 3 12 12 2 2 911 13 3 7 2 7 3 029
Hotels and restaurants
Other services
Note: The table excludes 26 cases with missing data.
Majority ownership by sector Majority ownership American Australian British Canadian Chinese Hong Kong Chinese French German Indian Indonesian Japanese Korean Malay Burmese Singaporean Taiwanese Thai Vietnamese Others Total
Agriculture
Extractive industries
Manufacturing
Total
1 0 0 3 0
0 0 0 0 0
0 0 0 4 13
0 0 0 0 2
0 0 0 1 0
2 2 1 1 12
3 2 1 9 27
0
0
2
0
0
0
2
0 0 0 0 2 1 0 399 3 0 1 0 2 412
1 0 1 0 0 0 0 119 0 0 0 0 0 121
1 0 5 2 4 9 2 958 2 3 3 1 1 1 010
0 0 0 1 2 1 0 533 1 0 1 0 0 541
0 0 0 0 1 0 0 210 0 0 1 1 1 215
0 2 3 0 3 1 0 682 7 0 1 0 3 720
2 2 9 3 12 12 2 2 901 13 3 7 2 7 3 019
Note: The table excludes 36 cases with missing data.
Â
Â
Trade
107