CHAPTER 1. The Services Sector in Africa: Emerging Trends
33
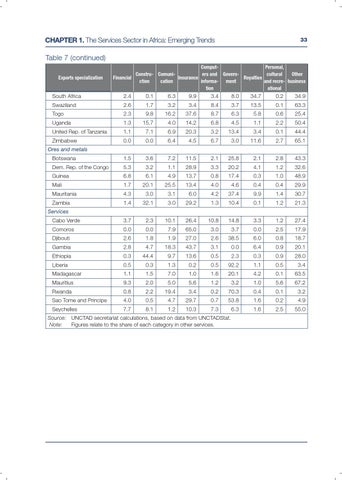
Table 7 (continued) Exports specialization
Financial
ComputPersonal, Constru- Comuniers and Governcultural Other Insurance Royalties ction cation informa- ment and recre- business tion ational
South Africa
2.4
0.1
6.3
9.9
3.4
8.0
34.7
0.2
34.9
Swaziland
2.6
1.7
3.2
3.4
8.4
3.7
13.5
0.1
63.3
Togo
2.3
9.8
16.2
37.6
8.7
6.3
5.8
0.6
25.4
Uganda
1.3
15.7
4.0
14.2
6.8
4.5
1.1
2.2
50.4
United Rep. of Tanzania
1.1
7.1
6.9
20.3
3.2
13.4
3.4
0.1
44.4
Zimbabwe
0.0
0.0
6.4
4.5
6.7
3.0
11.6
2.7
65.1
Ores and metals Botswana
1.5
3.6
7.2
11.5
2.1
25.8
2.1
2.8
43.3
Dem. Rep. of the Congo
5.3
3.2
1.1
28.9
3.3
20.2
4.1
1.2
32.6
Guinea
6.8
6.1
4.9
13.7
0.8
17.4
0.3
1.0
48.9
Mali
1.7
20.1
25.5
13.4
4.0
4.6
0.4
0.4
29.9
Mauritania
4.3
3.0
3.1
6.0
4.2
37.4
9.9
1.4
30.7
Zambia
1.4
32.1
3.0
29.2
1.3
10.4
0.1
1.2
21.3
Services Cabo Verde
3.7
2.3
10.1
26.4
10.8
14.8
3.3
1.2
27.4
Comoros
0.0
0.0
7.9
65.0
3.0
3.7
0.0
2.5
17.9
Djibouti
2.6
1.8
1.9
27.0
2.6
38.5
6.0
0.8
18.7
Gambia
2.8
4.7
18.3
43.7
3.1
0.0
6.4
0.9
20.1 28.0
Ethiopia
0.3
44.4
9.7
13.6
0.5
2.3
0.3
0.9
Liberia
0.5
0.3
1.3
0.2
0.5
92.2
1.1
0.5
3.4
Madagascar
1.1
1.5
7.0
1.0
1.6
20.1
4.2
0.1
63.5 67.2
Mauritius
9.3
2.0
5.0
5.6
1.2
3.2
1.0
5.6
Rwanda
0.8
2.2
19.4
3.4
0.2
70.3
0.4
0.1
3.2
Sao Tome and Principe
4.0
0.5
4.7
29.7
0.7
53.8
1.6
0.2
4.9
Seychelles
7.7
8.1
1.2
10.3
7.3
6.3
1.6
2.5
55.0
Source: UNCTAD secretariat calculations, based on data from UNCTADStat. Note: Figures relate to the share of each category in other services.