Economic Development in Africa Report 2015
32
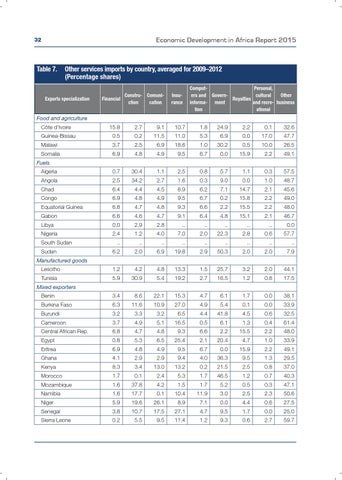
Table 7.
Other services imports by country, averaged for 2009–2012 (Percentage shares)
Exports specialization
Constru- ComuniFinancial ction cation
Insurance
ComputPersonal, ers and Governcultural Other Royalties informa- ment and recre- business tion ational
Food and agriculture CĂ´te d'Ivoire Guinea-Bissau
15.8
2.7
9.1
10.7
1.8
24.9
2.2
0.1
32.6
0.5
0.2
11.5
11.0
5.3
6.9
0.0
17.0
47.7
Malawi
3.7
2.5
6.9
18.6
1.0
30.2
0.5
10.0
26.5
Somalia
6.9
4.8
4.9
9.5
6.7
0.0
15.9
2.2
49.1
Fuels Algeria
0.7
30.4
1.1
2.5
0.8
5.7
1.1
0.3
57.5
Angola
2.5
34.2
2.7
1.6
0.3
9.0
0.0
1.0
48.7
Chad
6.4
4.4
4.5
8.9
6.2
7.1
14.7
2.1
45.6
Congo
6.9
4.8
4.9
9.5
6.7
0.2
15.8
2.2
49.0
Equatorial Guinea
6.8
4.7
4.8
9.3
6.6
2.2
15.5
2.2
48.0
Gabon
6.6
4.6
4.7
9.1
6.4
4.8
15.1
2.1
46.7
Libya
0.0
2.9
2.8
..
..
..
..
..
0.0
Nigeria
2.4
1.2
4.0
7.0
2.0
22.3
2.8
0.6
57.7
South Sudan Sudan
..
..
..
..
..
..
..
..
..
6.2
2.0
6.9
19.8
2.9
50.3
2.0
2.0
7.9
Manufactured goods Lesotho
1.2
4.2
4.8
13.3
1.5
25.7
3.2
2.0
44.1
Tunisia
5.9
30.9
5.4
19.2
2.7
16.5
1.2
0.8
17.5
Mixed exporters Benin
3.4
8.6
22.1
15.3
4.7
6.1
1.7
0.0
38.1
Burkina Faso
6.3
11.6
10.9
27.0
4.9
5.4
0.1
0.0
33.9
Burundi
3.2
3.3
3.2
6.5
4.4
41.8
4.5
0.6
32.5
Cameroon
3.7
4.9
5.1
16.5
0.5
6.1
1.3
0.4
61.4
Central African Rep.
6.8
4.7
4.8
9.3
6.6
2.2
15.5
2.2
48.0
Egypt
0.8
5.3
6.5
25.4
2.1
20.4
4.7
1.0
33.9
Eritrea
6.9
4.8
4.9
9.5
6.7
0.0
15.9
2.2
49.1
Ghana
4.1
2.9
2.9
9.4
4.0
36.3
9.5
1.3
29.5
Kenya
8.3
3.4
13.0
13.2
0.2
21.5
2.5
0.8
37.0
Morocco
1.7
0.1
2.4
5.3
1.7
46.5
1.2
0.7
40.3
Mozambique
1.6
37.8
4.2
1.5
1.7
5.2
0.5
0.3
47.1
Namibia
1.6
17.7
0.1
10.4
11.9
3.0
2.5
2.3
50.6
Niger
5.9
19.6
26.1
8.9
7.1
0.0
4.4
0.6
27.5
Senegal
3.8
10.7
17.5
27.1
4.7
9.5
1.7
0.0
25.0
Sierra Leone
0.2
5.5
9.5
11.4
1.2
9.3
0.6
2.7
59.7