CHAPTER 1. The Services Sector in Africa: Emerging Trends
31
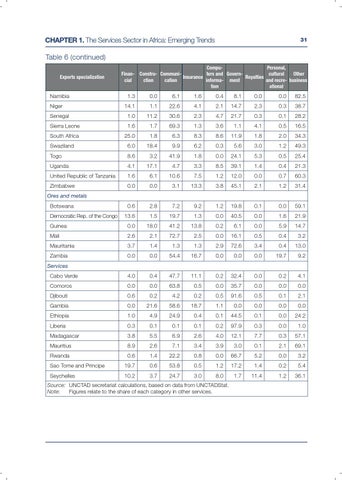
Table 6 (continued) Exports specialization
Namibia Niger
Financial
CompuPersonal, Constru- Communiters and GovernOther cultural Insurance Royalties ction cation informa- ment and recre- business tion ational
1.3
0.0
6.1
1.6
0.4
8.1
0.0
0.0
82.5
14.1
1.1
22.6
4.1
2.1
14.7
2.3
0.3
38.7
Senegal
1.0
11.2
30.6
2.3
4.7
21.7
0.3
0.1
28.2
Sierra Leone
1.6
1.7
69.3
1.3
3.6
1.1
4.1
0.5
16.5
South Africa
34.3
25.0
1.8
6.3
8.3
8.6
11.9
1.8
2.0
Swaziland
6.0
18.4
9.9
6.2
0.3
5.6
3.0
1.2
49.3
Togo
8.6
3.2
41.9
1.8
0.0
24.1
5.3
0.5
25.4
Uganda
4.1
17.1
4.7
3.3
8.5
39.1
1.4
0.4
21.3
United Republic of Tanzania
1.6
6.1
10.6
7.5
1.2
12.0
0.0
0.7
60.3
Zimbabwe
0.0
0.0
3.1
13.3
3.8
45.1
2.1
1.2
31.4
Ores and metals Botswana
0.6
2.8
7.2
9.2
1.2
19.8
0.1
0.0
59.1
13.6
1.5
19.7
1.3
0.0
40.5
0.0
1.6
21.9
Guinea
0.0
18.0
41.2
13.8
0.2
6.1
0.0
5.9
14.7
Mali
2.6
2.1
72.7
2.5
0.0
16.1
0.5
0.4
3.2
Mauritania
3.7
1.4
1.3
1.3
2.9
72.6
3.4
0.4
13.0
Zambia
0.0
0.0
54.4
16.7
0.0
0.0
0.0
19.7
9.2
Cabo Verde
4.0
0.4
47.7
11.1
0.2
32.4
0.0
0.2
4.1
Comoros
0.0
0.0
63.8
0.5
0.0
35.7
0.0
0.0
0.0
Djibouti
0.6
0.2
4.2
0.2
0.5
91.6
0.5
0.1
2.1
Gambia
0.0
21.6
58.6
18.7
1.1
0.0
0.0
0.0
0.0
Ethiopia
1.0
4.9
24.9
0.4
0.1
44.5
0.1
0.0
24.2
Liberia
0.3
0.1
0.1
0.1
0.2
97.9
0.3
0.0
1.0
Madagascar
3.8
5.5
6.9
2.6
4.0
12.1
7.7
0.3
57.1
Mauritius
8.9
2.6
7.1
3.4
3.9
3.0
0.1
2.1
69.1
Rwanda
0.6
1.4
22.2
0.8
0.0
66.7
5.2
0.0
3.2
Sao Tome and Principe
19.7
0.6
53.8
0.5
1.2
17.2
1.4
0.2
5.4
Seychelles
10.2
3.7
24.7
3.0
8.0
1.7
11.4
1.2
36.1
Democratic Rep. of the Congo
Services
Source: UNCTAD secretariat calculations, based on data from UNCTADStat. Note: Figures relate to the share of each category in other services.