Economic Development in Africa Report 2015
30
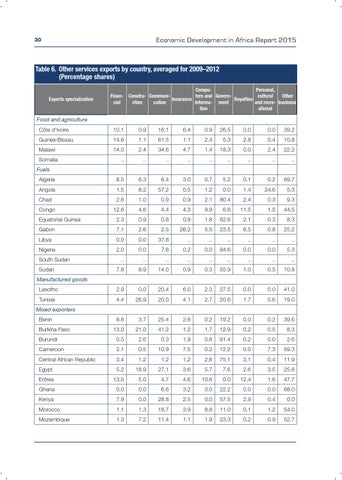
Table 6. Other services exports by country, averaged for 2009–2012 (Percentage shares) Exports specialization
Financial
CompuPersonal, Constru- Communiters and GovernOther cultural Insurance Royalties ction cation informa- ment and recre- business tion ational
Food and agriculture CĂ´te d'Ivoire
10.1
0.9
16.1
6.4
0.9
26.5
0.0
0.0
39.2
Guinea-Bissau
14.6
1.1
61.5
1.1
2.4
5.3
2.8
0.4
10.8
Malawi
14.0
2.4
34.6
4.7
1.4
18.3
0.0
2.4
22.2
..
..
..
..
..
..
..
..
..
8.5
6.3
6.4
3.0
0.7
5.2
0.1
0.2
69.7 5.3
Somalia Fuels Algeria Angola
1.5
8.2
57.2
0.5
1.2
0.0
1.4
24.6
Chad
2.6
1.0
0.9
0.9
2.1
80.4
2.4
0.3
9.3
Congo
12.6
4.6
4.4
4.3
9.9
6.6
11.5
1.5
44.5
Equatorial Guinea
2.3
0.9
0.8
0.8
1.8
82.6
2.1
0.3
8.3
Gabon
7.1
2.6
2.5
26.2
5.5
23.5
6.5
0.8
25.2
Libya
0.0
0.0
37.8
..
..
..
..
..
..
Nigeria
2.0
0.0
7.8
0.2
0.0
84.6
0.0
0.0
5.3
South Sudan Sudan
..
..
..
..
..
..
..
..
..
7.8
8.9
14.0
0.9
0.3
55.9
1.0
0.5
10.8
Manufactured goods Lesotho
2.9
0.0
20.4
6.0
2.3
27.5
0.0
0.0
41.0
Tunisia
4.4
26.9
20.0
4.1
2.7
20.6
1.7
0.6
19.0
Mixed exporters Benin
8.8
3.7
25.4
2.8
0.2
19.2
0.0
0.2
39.6
13.0
21.0
41.2
1.2
1.7
12.9
0.2
0.5
8.3
Burundi
0.5
2.6
0.3
1.9
0.6
91.4
0.2
0.0
2.6
Cameroon
2.1
0.5
10.9
7.5
0.2
12.2
0.0
7.3
59.3
Central African Republic
3.4
1.2
1.2
1.2
2.6
75.1
3.1
0.4
11.9
Egypt
5.2
18.9
27.1
3.6
5.7
7.6
2.6
3.5
25.8
Eritrea
13.5
5.0
4.7
4.6
10.6
0.0
12.4
1.6
47.7
Ghana
0.0
0.0
6.6
3.2
0.0
22.2
0.0
0.0
68.0
Burkina Faso
Kenya
7.9
0.0
28.8
2.5
0.0
57.5
2.9
0.4
0.0
Morocco
1.1
1.3
18.7
3.9
8.8
11.0
0.1
1.2
54.0
Mozambique
1.3
7.2
11.4
1.1
1.9
23.3
0.2
0.9
52.7