CHAPTER 1. The Services Sector in Africa: Emerging Trends
29
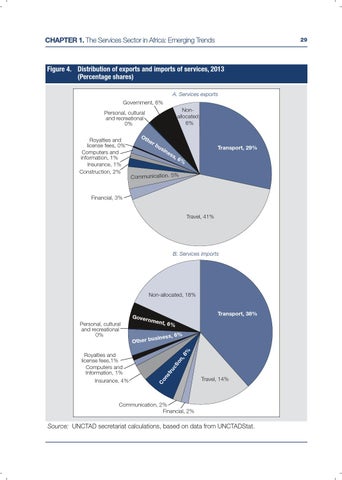
Figure 4. Distribution of exports and imports of services, 2013 (Percentage shares) A. Services exports Government, 6% Nonallocated 6%
Personal, cultural and recreational 0% Royalties and license fees, 0% Computers and information, 1% Insurance, 1% Construction, 2%
Ot
he
rb
us
ine
Transport, 29%
ss
,6
%
Communication. 5%
Financial, 3% Travel, 41%
B. Services imports
Non-allocated, 18%
t, 6%
, 6%
usiness
ct
io
n,
8%
Other b
tru
Royalties and license fees,1% Computers and Information, 1% Insurance, 4%
Transport, 38%
nmen
Co ns
Personal, cultural and recreational 0%
Gover
Travel, 14%
Communication, 2% Financial, 2%
Source: UNCTAD secretariat calculations, based on data from UNCTADStat.